Torpshammar facts for kids
Quick facts for kids
Torpshammar
|
|
|---|---|
| Country | Sweden |
| Province | Medelpad |
| County | Västernorrland County |
| Municipality | Ånge Municipality |
| Area | |
| • Total | 1.63 km2 (0.63 sq mi) |
| Population
(31 December 2010)
|
|
| • Total | 444 |
| • Density | 272/km2 (700/sq mi) |
| Time zone | UTC+1 (CET) |
| • Summer (DST) | UTC+2 (CEST) |
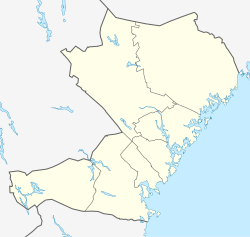
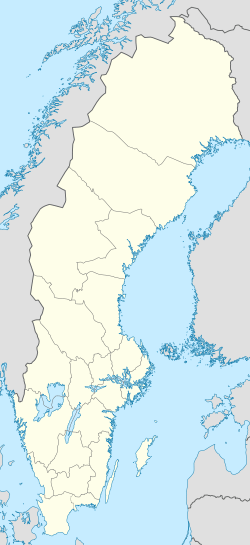
Torpshammar is a small community, or "locality," located in Sweden. You can find it in Ånge Municipality within Västernorrland County. In 2010, about 444 people called Torpshammar home. This place was started in 1797. It began as a community focused on processing iron. Torpshammar is also famous for being the first location of Boda Borg, a popular adventure game center.
Understanding Torpshammar's Climate
Torpshammar has traditionally experienced a subarctic climate. This means it used to have very long, cold winters and short, cool summers. However, due to recent warming trends, its climate is changing. It is now moving towards a humid continental climate. This type of climate has four clear seasons. Winters are still cold, but summers are warmer, even if they are still short.
| Climate data for Torpshammar 2002–2018; extremes since 1931 | |||||||||||||
|---|---|---|---|---|---|---|---|---|---|---|---|---|---|
| Month | Jan | Feb | Mar | Apr | May | Jun | Jul | Aug | Sep | Oct | Nov | Dec | Year |
| Record high °C (°F) | 9.8 (49.6) |
11.6 (52.9) |
18.2 (64.8) |
24.2 (75.6) |
29.0 (84.2) |
33.6 (92.5) |
33.9 (93.0) |
34.6 (94.3) |
26.7 (80.1) |
21.9 (71.4) |
14.2 (57.6) |
9.6 (49.3) |
34.6 (94.3) |
| Mean maximum °C (°F) | 4.4 (39.9) |
6.6 (43.9) |
11.5 (52.7) |
17.9 (64.2) |
24.7 (76.5) |
27.0 (80.6) |
29.4 (84.9) |
27.1 (80.8) |
22.2 (72.0) |
15.2 (59.4) |
8.9 (48.0) |
6.1 (43.0) |
30.4 (86.7) |
| Mean daily maximum °C (°F) | −3.8 (25.2) |
−1.7 (28.9) |
3.9 (39.0) |
10.1 (50.2) |
15.9 (60.6) |
19.6 (67.3) |
22.7 (72.9) |
20.5 (68.9) |
15.6 (60.1) |
8.0 (46.4) |
1.7 (35.1) |
−2.1 (28.2) |
9.2 (48.6) |
| Daily mean °C (°F) | −8.1 (17.4) |
−6.3 (20.7) |
−1.6 (29.1) |
4.0 (39.2) |
9.3 (48.7) |
13.3 (55.9) |
16.4 (61.5) |
14.8 (58.6) |
10.3 (50.5) |
3.8 (38.8) |
−1.5 (29.3) |
−5.9 (21.4) |
4.0 (39.3) |
| Mean daily minimum °C (°F) | −12.3 (9.9) |
−10.9 (12.4) |
−7.1 (19.2) |
−2.2 (28.0) |
2.7 (36.9) |
6.9 (44.4) |
10.1 (50.2) |
9.0 (48.2) |
4.9 (40.8) |
−0.4 (31.3) |
−4.7 (23.5) |
−9.6 (14.7) |
−1.1 (30.0) |
| Mean minimum °C (°F) | −25.5 (−13.9) |
−24.0 (−11.2) |
−19.5 (−3.1) |
−8.7 (16.3) |
−4.3 (24.3) |
0.2 (32.4) |
3.8 (38.8) |
2.0 (35.6) |
−2.0 (28.4) |
−8.0 (17.6) |
−14.6 (5.7) |
−21.4 (−6.5) |
−28.1 (−18.6) |
| Record low °C (°F) | −42.0 (−43.6) |
−38.8 (−37.8) |
−37.8 (−36.0) |
−19.4 (−2.9) |
−9.0 (15.8) |
−2.2 (28.0) |
0.2 (32.4) |
−1.6 (29.1) |
−7.9 (17.8) |
−20.0 (−4.0) |
−28.8 (−19.8) |
−41.7 (−43.1) |
−42.0 (−43.6) |
| Average precipitation mm (inches) | 31.7 (1.25) |
21.2 (0.83) |
18.3 (0.72) |
22.9 (0.90) |
46.5 (1.83) |
61.1 (2.41) |
72.9 (2.87) |
81.9 (3.22) |
41.5 (1.63) |
43.6 (1.72) |
32.5 (1.28) |
36.2 (1.43) |
510.3 (20.09) |
| Source 1: SMHI Open Data | |||||||||||||
| Source 2: SMHI climate data 2002–2018 | |||||||||||||
 | Kyle Baker |
 | Joseph Yoakum |
 | Laura Wheeler Waring |
 | Henry Ossawa Tanner |


