Uddevalla Municipality facts for kids
Quick facts for kids
Uddevalla Municipality
Uddevalla kommun
|
||
|---|---|---|
 |
||
|
||
 |
||
| Country | Sweden | |
| County | Västra Götaland County | |
| Seat | Uddevalla | |
| Area | ||
| • Total | 737.1 km2 (284.6 sq mi) | |
| • Land | 641.93 km2 (247.85 sq mi) | |
| • Water | 95.17 km2 (36.75 sq mi) | |
| Area as of January 1, 2010. | ||
| Population
(June 30, 2012)
|
||
| • Total | 51,840 | |
| • Density | 70.330/km2 (182.153/sq mi) | |
| Time zone | UTC+1 (CET) | |
| • Summer (DST) | UTC+2 (CEST) | |
| ISO 3166 code | SE | |
| Province | Bohuslän | |
| Municipal code | 1485 | |
| Website | www.uddevalla.se | |
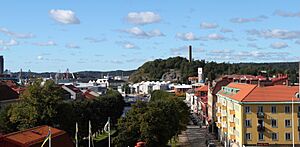
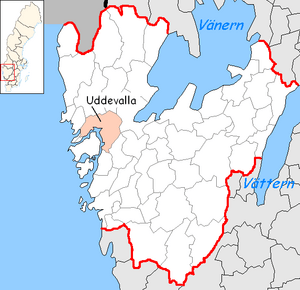
Uddevalla Municipality (which is called Uddevalla kommun in Swedish) is a special type of local government area in western Sweden. It is part of Västra Götaland County. The main town and administrative center of the municipality is Uddevalla.
This municipality was formed in 1971. Before that, the City of Uddevalla had already joined with a nearby rural area called Bäve in 1945. Then, in 1971, the city combined with several surrounding areas. These areas included Forshälla, Lane-Ryr, Ljungskile, Skredsvik, and parts of Skaftö.
Towns and Villages in Uddevalla Municipality
Uddevalla Municipality is home to several towns and villages. Each of these places has its own unique character. The largest and most central town is Uddevalla itself, which is where the main offices for the municipality are located.
Here are some of the important places you can find in Uddevalla Municipality:
- Ammenäs
- Fagerhult
- Herrestad
- Hogstorp
- Ljungskile
- Sunningen
- Uddevalla (This is the main town and where the municipality's government is located.)
People and Population
Understanding the people who live in Uddevalla Municipality helps us learn more about the area. The information about the population comes from official statistics.
In 2022, there were 57,031 people living in Uddevalla Municipality. Out of these, 43,062 were Swedish citizens old enough to vote. When people voted in the 2022 Swedish general election, 45.7% of them voted for the left-leaning political groups. Meanwhile, 52.3% voted for the right-leaning political groups.
See also
 In Spanish: Municipio de Uddevalla para niños
 | Charles R. Drew |
 | Benjamin Banneker |
 | Jane C. Wright |
 | Roger Arliner Young |


