Wainwright, Alaska facts for kids
Quick facts for kids
Wainwright
Ulġuniq
|
|
|---|---|

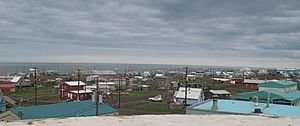
Wainwright during the summer months with the Arctic Ocean in the background
|
|
| Country | United States |
| State | Alaska |
| Borough | North Slope |
| Incorporated | December 31, 1962 |
| Area | |
| • Total | 28.04 sq mi (72.61 km2) |
| • Land | 10.31 sq mi (26.71 km2) |
| • Water | 17.72 sq mi (45.90 km2) |
| Elevation | 33 ft (10 m) |
| Population
(2020)
|
|
| • Total | 628 |
| • Density | 60.89/sq mi (23.51/km2) |
| Time zone | UTC−9 (Alaska (AKST)) |
| • Summer (DST) | UTC−8 (AKDT) |
| ZIP code |
99782
|
| Area code | 907 |
| FIPS code | 02-82750 |
| GNIS feature ID | 2418869 |
Wainwright (pronounced WAYN-ryte) is a city in North Slope Borough, Alaska, United States. Its name in the Iñupiaq language is Ulġuniq. It is also sometimes called Ulguniq or Kuuk.
In 2020, 628 people lived in Wainwright. This makes it the third largest city in the North Slope Borough. The city's name comes from Wainwright Lagoon. This lagoon was named after Lt. John Wainwright, who explored the area in 1826. Wainwright officially became a city in 1904.
Contents
Where is Wainwright? (Geography)
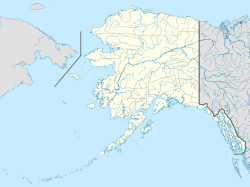
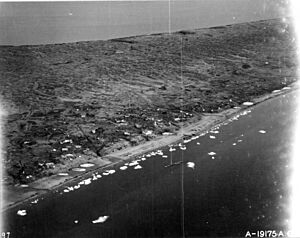
Wainwright is located on the coast of the Chukchi Sea. This is about 72 miles (116 km) southwest of Utqiaġvik, another city in Alaska.
The city covers a total area of about 28 square miles (72.6 square kilometers). Most of this area, about 17.7 square miles (45.9 square kilometers), is water. The land area is about 10.3 square miles (26.7 square kilometers).
What is the climate like?
Wainwright has a very cold, dry Arctic climate. Temperatures can range from very cold in winter to cool in summer. The coldest temperatures can drop to -56°F (-49°C). The warmest summer days can reach 84°F (29°C).
There isn't much rain or snow in Wainwright. Most of the precipitation is snow. The Chukchi Sea near Wainwright is usually not frozen from early July to late September.
| Climate data for Wainwright, Alaska (Wainwright Airport (Alaska)), 1991–2020 normals, extremes 1998–present | |||||||||||||
|---|---|---|---|---|---|---|---|---|---|---|---|---|---|
| Month | Jan | Feb | Mar | Apr | May | Jun | Jul | Aug | Sep | Oct | Nov | Dec | Year |
| Record high °F (°C) | 40 (4) |
45 (7) |
50 (10) |
40 (4) |
61 (16) |
74 (23) |
84 (29) |
74 (23) |
61 (16) |
44 (7) |
37 (3) |
35 (2) |
84 (29) |
| Mean maximum °F (°C) | 20.9 (−6.2) |
24.1 (−4.4) |
17.4 (−8.1) |
29.8 (−1.2) |
44.7 (7.1) |
65.4 (18.6) |
69.6 (20.9) |
62.1 (16.7) |
54.3 (12.4) |
38.0 (3.3) |
30.2 (−1.0) |
24.1 (−4.4) |
71.1 (21.7) |
| Mean daily maximum °F (°C) | −3.9 (−19.9) |
−4.7 (−20.4) |
−3.5 (−19.7) |
10.8 (−11.8) |
28.9 (−1.7) |
45.9 (7.7) |
52.2 (11.2) |
48.5 (9.2) |
38.9 (3.8) |
25.7 (−3.5) |
11.8 (−11.2) |
−0.3 (−17.9) |
20.9 (−6.2) |
| Daily mean °F (°C) | −10.8 (−23.8) |
−11.4 (−24.1) |
−10.6 (−23.7) |
3.8 (−15.7) |
24.1 (−4.4) |
39.4 (4.1) |
45.5 (7.5) |
43.1 (6.2) |
34.9 (1.6) |
20.9 (−6.2) |
5.4 (−14.8) |
−6.6 (−21.4) |
14.8 (−9.6) |
| Mean daily minimum °F (°C) | −17.6 (−27.6) |
−18.2 (−27.9) |
−17.8 (−27.7) |
−3.3 (−19.6) |
19.4 (−7.0) |
33.0 (0.6) |
38.8 (3.8) |
37.8 (3.2) |
30.9 (−0.6) |
16.0 (−8.9) |
−1.0 (−18.3) |
−12.9 (−24.9) |
8.8 (−12.9) |
| Mean minimum °F (°C) | −34.6 (−37.0) |
−36.7 (−38.2) |
−32.3 (−35.7) |
−21.9 (−29.9) |
1.5 (−16.9) |
25.9 (−3.4) |
33.3 (0.7) |
31.7 (−0.2) |
22.4 (−5.3) |
0.7 (−17.4) |
−18.7 (−28.2) |
−29.7 (−34.3) |
−40.2 (−40.1) |
| Record low °F (°C) | −50 (−46) |
−53 (−47) |
−47 (−44) |
−29 (−34) |
−14 (−26) |
18 (−8) |
27 (−3) |
23 (−5) |
14 (−10) |
−16 (−27) |
−33 (−36) |
−44 (−42) |
−53 (−47) |
| Average precipitation inches (mm) | 0.02 (0.51) |
0.02 (0.51) |
0.03 (0.76) |
0.06 (1.5) |
0.19 (4.8) |
0.45 (11) |
0.94 (24) |
0.73 (19) |
0.31 (7.9) |
0.17 (4.3) |
0.13 (3.3) |
0.05 (1.3) |
3.1 (78.88) |
| Average precipitation days (≥ 0.01 in) | 0.8 | 1.0 | 1.3 | 1.1 | 3.8 | 6.3 | 9.6 | 9.8 | 7.2 | 6.2 | 3.6 | 2.1 | 52.8 |
| Source 1: NOAA | |||||||||||||
| Source 2: National Weather Service (mean maxima and minima, precip/precip days 2006–2020) | |||||||||||||
Who lives in Wainwright? (Demographics)
| Historical population | |||
|---|---|---|---|
| Census | Pop. | %± | |
| 1890 | 72 | — | |
| 1920 | 99 | — | |
| 1930 | 197 | 99.0% | |
| 1940 | 341 | 73.1% | |
| 1950 | 227 | −33.4% | |
| 1960 | 253 | 11.5% | |
| 1970 | 315 | 24.5% | |
| 1980 | 405 | 28.6% | |
| 1990 | 492 | 21.5% | |
| 2000 | 546 | 11.0% | |
| 2010 | 556 | 1.8% | |
| 2020 | 628 | 12.9% | |
| U.S. Decennial Census | |||
Wainwright first appeared on the U.S. Census in 1890. At that time, it was called "Wainwright Inlet." It included several native settlements. All 72 people living there in 1890 were native. The area officially became a city in 1962.

In 2010, there were 556 people in Wainwright. Most of the people (90.1%) were Native American. About 7.9% were White, and 1.6% were from two or more races. A small number, 0.4%, were Hispanic or Latino.
In 2000, there were 546 people living in 148 households. About half of the households (50%) had children under 18 living with them. The average household had about 3.69 people. The average family had about 4.17 people.
Many young people live in Wainwright. About 37.7% of the population was under 18 years old in 2000. The average age was 24 years.
The average income for a household in 2000 was $54,722. For families, the average income was $58,125. About 12.5% of the population lived below the poverty line.
Education in Wainwright
Wainwright has one school called the Alak School. This school is part of the North Slope Borough School District. It teaches students from pre-kindergarten all the way through 12th grade.
See also
 In Spanish: Wainwright (Alaska) para niños
 | Sharif Bey |
 | Hale Woodruff |
 | Richmond Barthé |
 | Purvis Young |


