
Wallingford, Iowa facts for kids
Quick facts for kids
Wallingford, Iowa
|
|
|---|---|

Location of Wallingford, Iowa
|
|
| Country | |
| State | |
| County | Emmet |
| Area | |
| • Total | 0.99 sq mi (2.56 km2) |
| • Land | 0.99 sq mi (2.56 km2) |
| • Water | 0.00 sq mi (0.00 km2) |
| Elevation | 1,273 ft (388 m) |
| Population
(2020)
|
|
| • Total | 165 |
| • Density | 167.00/sq mi (64.50/km2) |
| Time zone | UTC-6 (Central (CST)) |
| • Summer (DST) | UTC-5 (CDT) |
| ZIP code |
51365
|
| Area code(s) | 712 |
| FIPS code | 19-81975 |
| GNIS feature ID | 0462622 |
Wallingford is a small city located in Emmet County, Iowa, in the United States. It's a quiet place where people live and work. In 2020, a count of everyone living there, called a census, showed that 165 people called Wallingford home.
Contents
History of Wallingford
Wallingford was officially planned and marked out in 1882. This process, called "platting," means that the streets, lots, and public areas were drawn on a map. This helped people buy land and build homes in an organized way.
Geography and Location
Wallingford is located in the state of Iowa. You can find it on a map at these coordinates: 43 degrees, 19 minutes, 9 seconds North and 94 degrees, 47 minutes, 36 seconds West.
Size of the City
The city covers a total area of about 0.97 square miles (or 2.56 square kilometers). All of this area is land, meaning there are no large lakes or rivers within the city limits.
Population and People
The number of people living in Wallingford has changed over the years. Here's a look at how the population has grown and shrunk:
| Historical populations | ||
|---|---|---|
| Year | Pop. | ±% |
| 1920 | 197 | — |
| 1930 | 225 | +14.2% |
| 1940 | 233 | +3.6% |
| 1950 | 229 | −1.7% |
| 1960 | 228 | −0.4% |
| 1970 | 245 | +7.5% |
| 1980 | 256 | +4.5% |
| 1990 | 235 | −8.2% |
| 2000 | 210 | −10.6% |
| 2010 | 197 | −6.2% |
| 2019 | 173 | −12.2% |
| 2020 | 165 | −4.6% |
| Source: and Iowa Data Center Source: |
||
What the 2020 Census Showed
In 2020, the census counted 165 people living in Wallingford. These people lived in 77 different homes, and 47 of these were families.
Population Density
The city has about 167 people living in each square mile. This is called the population density. It tells us how crowded an area is.
Who Lives in Wallingford
Most people in Wallingford are White. A small number of residents are Native American or from other backgrounds. About 16 out of every 100 people are of Hispanic or Latino heritage.
Homes and Families
Out of the 77 homes, about a third had children under 18 living there. Many homes were married couples living together. Some homes had a single parent, either a mom or a dad.
Age Groups
The average age in Wallingford in 2020 was about 48.5 years old.
- About 20% of the people were under 20 years old.
- About 5.5% were between 20 and 24.
- About 17.6% were between 25 and 44.
- About 30.9% were between 45 and 64.
- About 26.1% were 65 years old or older.
The city has slightly more females (52.1%) than males (47.9%).
What the 2010 Census Showed
In 2010, there were 197 people living in Wallingford. They lived in 79 homes, and 54 of these were families. The population density was about 203 people per square mile. Most residents were White.
Families in 2010
About 33% of homes had children under 18. Most homes were married couples. The average home had about 2.49 people, and the average family had about 2.96 people.
Age Groups in 2010
The average age in 2010 was 35.9 years.
- About 26.4% of residents were under 18.
- About 8.1% were between 18 and 24.
- About 26.4% were between 25 and 44.
- About 25.9% were between 45 and 64.
- About 13.2% were 65 or older.
The city had slightly more females (51.3%) than males (48.7%).
Education in Wallingford
Students in Wallingford attend public schools operated by the Estherville–Lincoln Central Community School District. This school district was formed in 1997 when the Estherville and Lincoln Central school districts joined together.
Images for kids
-
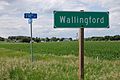
Approaching Wallingford whilst heading north on Iowa Highway 4.
-
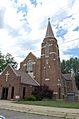
The Wallingford Lutheran Church on St. James Ave.
-
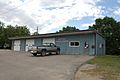
The Fire Department and City Hall.


See also
 In Spanish: Wallingford (Iowa) para niños
