Woodford, South Carolina facts for kids
Quick facts for kids
Woodford, South Carolina
|
|
|---|---|

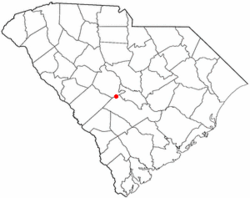
Location in Orangeburg County, South Carolina
|
|
| Country | United States |
| State | South Carolina |
| County | Orangeburg |
| Area | |
| • Total | 0.79 sq mi (2.03 km2) |
| • Land | 0.79 sq mi (2.03 km2) |
| • Water | 0.00 sq mi (0.00 km2) |
| Elevation | 381 ft (116 m) |
| Population
(2020)
|
|
| • Total | 161 |
| • Density | 205.10/sq mi (79.18/km2) |
| Time zone | UTC-5 (EST) |
| • Summer (DST) | UTC-4 (EDT) |
| ZIP code |
29112
|
| Area code(s) | 803 |
| FIPS code | 45-78910 |
| GNIS feature ID | 1231936 |
Woodford is a small town located in Orangeburg County, South Carolina, in the United States. It's a quiet place where people live and work. In 2010, the town had a population of 185 people. By 2020, this number changed to 161 residents.
Contents
Where is Woodford Located?
Woodford is found in the state of South Carolina. Its exact location can be described using coordinates: 33.667720 degrees North and 81.112088 degrees West. This helps pinpoint the town on a map.
The town of Woodford covers a total area of about 0.8 square miles (which is about 2.03 square kilometers). All of this area is land, meaning there are no large lakes or rivers within the town's official borders.
How Has Woodford's Population Changed?
The number of people living in Woodford has changed over many years. Here's a look at how the population has grown and shrunk since 1900:
| Historical population | |||
|---|---|---|---|
| Census | Pop. | %± | |
| 1900 | 205 | — | |
| 1910 | 190 | −7.3% | |
| 1920 | 144 | −24.2% | |
| 1930 | 223 | 54.9% | |
| 1940 | 211 | −5.4% | |
| 1950 | 179 | −15.2% | |
| 1960 | 172 | −3.9% | |
| 1970 | 195 | 13.4% | |
| 1980 | 206 | 5.6% | |
| 1990 | 200 | −2.9% | |
| 2000 | 196 | −2.0% | |
| 2010 | 185 | −5.6% | |
| 2020 | 161 | −13.0% | |
| U.S. Decennial Census | |||
Who Lives in Woodford?
The United States Census helps us understand the different groups of people living in Woodford. It looks at their backgrounds and how many people belong to each group.
Here's a breakdown of the town's population by race and ethnicity, based on census information:
| Race / Ethnicity (NH = Non-Hispanic) | Pop 2000 | Pop 2010 | Pop 2020 | % 2000 | % 2010 | % 2020 |
|---|---|---|---|---|---|---|
| White alone (NH) | 94 | 75 | 71 | 47.96% | 40.54% | 44.10% |
| Black or African American alone (NH) | 97 | 97 | 79 | 49.49% | 52.43% | 49.07% |
| Native American or Alaska Native alone (NH) | 0 | 3 | 1 | 0.00% | 1.62% | 0.62% |
| Asian alone (NH) | 0 | 0 | 0 | 0.00% | 0.00% | 0.00% |
| Pacific Islander alone (NH) | 0 | 0 | 0 | 0.00% | 0.00% | 0.00% |
| Some Other Race alone (NH) | 2 | 0 | 0 | 1.02% | 0.00% | 0.00% |
| Mixed Race or Multi-Racial (NH) | 0 | 0 | 6 | 0.00% | 0.00% | 3.73% |
| Hispanic or Latino (any race) | 3 | 10 | 4 | 1.53% | 5.41% | 2.48% |
| Total | 196 | 185 | 161 | 100.00% | 100.00% | 100.00% |
In the year 2000, there were 196 people living in Woodford. These people lived in 81 different homes, and 54 of those were families. The population was a mix of different backgrounds. About half the people were African American, and almost half were White. A small number of people were from other racial groups or had mixed backgrounds.
The average age of people in Woodford in 2000 was 41 years old. About 22.4% of the population was under 18 years old. This means there were quite a few kids and teenagers living in the town.
What About Money in Woodford?
In 2000, the average income for a household in Woodford was about $24,792 per year. For families, the average income was higher, around $36,875. This information helps us understand the economic situation of the town's residents.
See also
 In Spanish: Woodford (Carolina del Sur) para niños
 | Emma Amos |
 | Edward Mitchell Bannister |
 | Larry D. Alexander |
 | Ernie Barnes |

