Amber Valley (UK Parliament constituency) facts for kids
Quick facts for kids {{{Name}}}[[{{{Type}}} constituency]] |
|
|---|---|
| [[Image:{{{Map1}}}Constituency.svg|120px|]] [[Image:England{{{Map2}}}.svg|120px|]] |
|
| {{{Name}}} shown within [[{{{Entity}}}]], and {{{Entity}}} shown within England | |
| Created: | {{{Year}}} |
| MP: | {{{MP}}} |
| Party: | {{{Party}}} |
| Type: | House of Commons |
| County: | [[{{{County}}}]] |
| EP constituency: | [[{{{EP}}} (European Parliament constituency)|{{{EP}}}]] |
Amber Valley is an area in Derbyshire, England, that elects one person to represent it in the Parliament of the United Kingdom. This area is called a constituency. The person who represents Amber Valley in Parliament is called a Member of Parliament (MP).
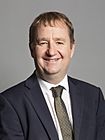
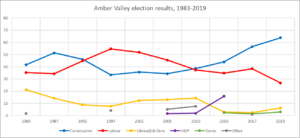
Since 2010, Nigel Mills from the Conservative Party has been the MP for Amber Valley. The Amber Valley constituency was first created in 1983. It was formed from parts of three older constituencies: Belper, Derbyshire South East, and Ilkeston.
Contents
Who Represents Amber Valley?
A Member of Parliament (MP) is someone elected by the people in their constituency to speak for them in the House of Commons. The House of Commons is where new laws are discussed and decided for the whole country.
Here is a list of the people who have been the MP for Amber Valley since it was created:
| Parliament | Years | Member | Party | ||
|---|---|---|---|---|---|
| This constituency was created from Belper, South East Derbyshire and Ilkeston | |||||
| 49th | 1983–1987 | Phillip Oppenheim | Conservative | ||
| 50th | 1987–1992 | ||||
| 51st | 1992–1997 | ||||
| 52nd | 1997–2001 | Judy Mallaber | Labour | ||
| 53rd | 2001–2005 | ||||
| 54th | 2005–2010 | ||||
| 55th | 2010–2015 | Nigel Mills |  |
Conservative | |
| 56th | 2015–2017 | ||||
| 57th | 2017–2019 | ||||
| 58th | 2019–present | ||||
How Elections Work in Amber Valley
Every few years, people in Amber Valley vote to choose their MP in a general election. The person who gets the most votes wins and becomes the MP.
Recent Election Results (2019)
In the most recent general election in 2019, people in Amber Valley voted for their MP. Here's how the votes were counted:
- Nigel Mills (Conservative Party) won with 29,096 votes. This was 63.8% of all the votes.
- Adam Thompson (Labour Party) received 12,210 votes (26.8%).
- Kate Smith (Liberal Democrats) received 2,873 votes (6.3%).
- Lian Pizzey (Green Party) received 1,388 votes (3.0%).
Nigel Mills won by a large number of votes, called a majority, which was 16,886 votes. This means he got 16,886 more votes than the person in second place.
The turnout for this election was 65.1%. This means that 65.1% of all the people who were allowed to vote actually did vote.
Previous Election Results (2017)
In the 2017 general election, Nigel Mills also won:
- Nigel Mills (Conservative Party) won with 25,905 votes (56.5%).
- James Dawson (Labour Party) received 17,605 votes (38.4%).
- Kate Smith (Liberal Democrats) received 1,100 votes (2.4%).
- Matt McGuinness (Green Party) received 650 votes (1.4%).
- Daniel Bamford (Independent) received 551 votes (1.2%).
Nigel Mills' majority in 2017 was 8,300 votes. The turnout was 67.4%.
Election Results (2015)
In the 2015 general election, Nigel Mills won again:
- Nigel Mills (Conservative Party) won with 20,106 votes (44.0%).
- Kevin Gillott (Labour Party) received 15,901 votes (34.8%).
- Stuart Bent (UK Independence Party) received 7,263 votes (15.9%).
- Kate Smith (Liberal Democrats) received 1,360 votes (3.0%).
- John Devine (Green Party) received 1,087 votes (2.4%).
Nigel Mills' majority in 2015 was 4,205 votes. The turnout was 65.1%.
Election Results (2010)
The 2010 general election was when Nigel Mills first became the MP for Amber Valley:
- Nigel Mills (Conservative Party) won with 17,746 votes (38.6%).
- Judy Mallaber (Labour Party) received 17,210 votes (37.4%).
- Tom Snowdon (Liberal Democrats) received 6,636 votes (14.4%).
- Michael Clarke (British National Party) received 3,195 votes (7.0%).
- Sue Ransome (UK Independence Party) received 906 votes (2.0%).
- Sam Thing (Official Monster Raving Loony Party) received 265 votes (0.6%).
Nigel Mills won by a very small majority of 536 votes. The turnout was 65.5%. This election was a "gain" for the Conservative Party, meaning they won the seat from the Labour Party.
 | John T. Biggers |
 | Thomas Blackshear |
 | Mark Bradford |
 | Beverly Buchanan |


