Bedford Heights, Ohio facts for kids
Quick facts for kids
Bedford Heights, Ohio
|
|
|---|---|

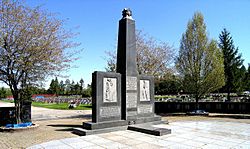
Holocaust memorial
|
|

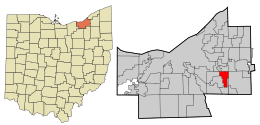
Location in Cuyahoga County and the state of Ohio.
|
|
| Country | United States |
| State | Ohio |
| County | Cuyahoga |
| Area | |
| • Total | 4.56 sq mi (11.81 km2) |
| • Land | 4.55 sq mi (11.78 km2) |
| • Water | 0.01 sq mi (0.03 km2) |
| Elevation | 1,037 ft (316 m) |
| Population
(2020)
|
|
| • Total | 11,020 |
| • Estimate
(2023)
|
10,721 |
| • Density | 2,423.58/sq mi (935.73/km2) |
| Time zone | UTC-5 (Eastern (EST)) |
| • Summer (DST) | UTC-4 (EDT) |
| ZIP codes |
44128, 44146
|
| Area codes | 440 |
| FIPS code | 39-04920 |
| GNIS feature ID | 1085952 |
Bedford Heights is a city located in Cuyahoga County, Ohio, in the United States. In 2020, about 11,020 people lived there. It is a suburb of Cleveland and part of the larger Cleveland metropolitan area.
Contents
History of Bedford Heights
Bedford Heights became a city on February 20, 1951. Before that, it was part of Bedford Township and the city of Bedford, Ohio. Robert E. Willeford and his wife, Georgina Willeford, worked hard to help create the village of Bedford Heights. Robert E. Willeford later became the first mayor of the city.
A special memorial called the Kol Israel Foundation Holocaust Memorial is located in Zion Memorial Park. It was opened on May 28, 1961. In 2022, this monument was officially recognized as a US national memorial.
Geography of Bedford Heights
Bedford Heights covers a total area of about 4.55 square miles (11.78 square kilometers). Most of this area is land, with only a very small part being water.
People of Bedford Heights
| Historical population | |||
|---|---|---|---|
| Census | Pop. | %± | |
| 1960 | 5,275 | — | |
| 1970 | 13,063 | 147.6% | |
| 1980 | 13,214 | 1.2% | |
| 1990 | 12,131 | −8.2% | |
| 2000 | 11,375 | −6.2% | |
| 2010 | 10,751 | −5.5% | |
| 2020 | 11,020 | 2.5% | |
| 2023 (est.) | 10,721 | −0.3% | |
| Sources: | |||
In 2010, there were 10,751 people living in Bedford Heights. About 76.9% of the people were African American, and 18.7% were White. A small number of people were Asian, Native American, or from other backgrounds. About 2.6% of the population was Hispanic or Latino.
The average age of people in the city was about 43.3 years old. About 19.9% of the residents were under 18 years old. Also, 16.8% of the people were 65 years old or older. More women live in Bedford Heights than men, with women making up about 54.1% of the population.
Neighboring Cities
Bedford Heights is surrounded by several other communities.
 |
North Randall | Warrensville Heights | Orange |  |
| Maple Heights | Solon | |||
| Bedford | Oakwood | Oakwood |
See also
 In Spanish: Bedford Heights (Ohio) para niños
 | James B. Knighten |
 | Azellia White |
 | Willa Brown |

