
Canyonville, Oregon facts for kids
Quick facts for kids
Canyonville, Oregon
|
|
|---|---|
 |
|

Location in Oregon
|
|
| Country | United States |
| State | Oregon |
| County | Douglas |
| Incorporated | 1901 |
| Area | |
| • Total | 1.06 sq mi (2.75 km2) |
| • Land | 1.06 sq mi (2.75 km2) |
| • Water | 0.00 sq mi (0.00 km2) |
| Elevation | 745 ft (227 m) |
| Population
(2020)
|
|
| • Total | 1,640 |
| • Density | 1,542.80/sq mi (595.56/km2) |
| Time zone | UTC-8 (Pacific) |
| • Summer (DST) | UTC-7 (Pacific) |
| ZIP code |
97417
|
| Area code(s) | 541 |
| FIPS code | 41-11000 |
| GNIS feature ID | 2409980 |
| Website | www.cityofcanyonville.com |
Canyonville is a small city in Douglas County, Oregon, United States. In 2020, about 1,640 people lived there. It is known for the Seven Feathers Casino Resort, a popular place for visitors. Near Canyonville, you can also find the Weaver-Worthington Farmstead, which is a very old and important historical site.
About Canyonville
Canyonville is located in the beautiful state of Oregon. It's about 100 miles (160 km) north of the Oregon-California border. The city is also about 200 miles (320 km) south of Portland, Oregon, a much larger city.
Interstate 5, a major highway, runs right through Canyonville. This makes it easy to travel to and from the city. Canyon Creek also flows through Canyonville. It eventually joins the South Umpqua River.
The city itself is quite small in size. It covers an area of about 1 square mile (2.75 square kilometers). All of this area is land, with no large bodies of water inside the city limits.
Weather in Canyonville
Canyonville has a special kind of weather called a Mediterranean climate. This means it has cool, wet winters and warm, dry summers. It also has some features of an oceanic climate, which means temperatures are generally mild.
The table below shows the average temperatures and rainfall for Canyonville. You can see how the weather changes throughout the year.
| Climate data for Canyonville, OR | |||||||||||||
|---|---|---|---|---|---|---|---|---|---|---|---|---|---|
| Month | Jan | Feb | Mar | Apr | May | Jun | Jul | Aug | Sep | Oct | Nov | Dec | Year |
| Record high °F (°C) | 73 (23) |
80 (27) |
86 (30) |
93 (34) |
106 (41) |
113 (45) |
108 (42) |
110 (43) |
108 (42) |
102 (39) |
81 (27) |
74 (23) |
113 (45) |
| Mean daily maximum °F (°C) | 49 (9) |
54 (12) |
58 (14) |
63 (17) |
69 (21) |
76 (24) |
83 (28) |
84 (29) |
79 (26) |
68 (20) |
55 (13) |
48 (9) |
66 (19) |
| Mean daily minimum °F (°C) | 34 (1) |
36 (2) |
37 (3) |
40 (4) |
44 (7) |
49 (9) |
53 (12) |
52 (11) |
47 (8) |
41 (5) |
38 (3) |
34 (1) |
42 (6) |
| Record low °F (°C) | −3 (−19) |
8 (−13) |
18 (−8) |
23 (−5) |
26 (−3) |
34 (1) |
35 (2) |
36 (2) |
24 (−4) |
17 (−8) |
13 (−11) |
3 (−16) |
−3 (−19) |
| Average precipitation inches (mm) | 4.70 (119) |
3.86 (98) |
3.51 (89) |
2.42 (61) |
1.56 (40) |
0.86 (22) |
0.38 (9.7) |
0.62 (16) |
1.01 (26) |
2.15 (55) |
5.20 (132) |
5.28 (134) |
31.55 (801.7) |
| Average snowfall inches (cm) | 2.90 (7.4) |
1.00 (2.5) |
0.50 (1.3) |
0 (0) |
0 (0) |
0 (0) |
0 (0) |
0 (0) |
0 (0) |
0 (0) |
0.50 (1.3) |
1.70 (4.3) |
6.60 (16.8) |
| Source: http://www.intellicast.com/Local/History.aspx?location=USOR0055 | |||||||||||||
Population History
The population of Canyonville has changed over the years. Here is a look at how many people have lived in the city during different census years:
| Historical population | |||
|---|---|---|---|
| Census | Pop. | %± | |
| 1910 | 149 | — | |
| 1920 | 156 | 4.7% | |
| 1930 | 167 | 7.1% | |
| 1940 | 255 | 52.7% | |
| 1950 | 861 | 237.6% | |
| 1960 | 1,089 | 26.5% | |
| 1970 | 940 | −13.7% | |
| 1980 | 1,288 | 37.0% | |
| 1990 | 1,219 | −5.4% | |
| 2000 | 1,293 | 6.1% | |
| 2010 | 1,884 | 45.7% | |
| 2020 | 1,640 | −13.0% | |
| U.S. Decennial Census | |||
In 2010, the city had 1,884 people living in 756 households. About 25% of these households had children under 18. The average age of people in Canyonville was about 46.5 years old. The population was almost evenly split between males and females.
Images for kids
-
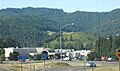
A view of Canyonville, Oregon.
See also
 In Spanish: Canyonville para niños
