Catron, Missouri facts for kids
Quick facts for kids
Catron, Missouri
|
|
|---|---|

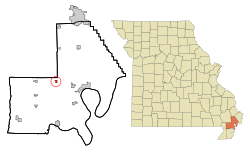
Location of Catron, Missouri
|
|
| Country | United States |
| State | Missouri |
| County | New Madrid |
| Area | |
| • Total | 0.37 sq mi (0.96 km2) |
| • Land | 0.37 sq mi (0.96 km2) |
| • Water | 0.00 sq mi (0.00 km2) |
| Elevation | 282 ft (86 m) |
| Population
(2020)
|
|
| • Total | 41 |
| • Density | 110.22/sq mi (42.58/km2) |
| Time zone | UTC-6 (Central (CST)) |
| • Summer (DST) | UTC-5 (CDT) |
| ZIP code |
63833
|
| Area code(s) | 573 |
| FIPS code | 29-12052 |
| GNIS feature ID | 2396630 |
Catron is a small city in New Madrid County, Missouri, United States. In 2010, about 67 people lived there. By 2020, the population was 41.
Contents
History of Catron
A post office has been open in Catron since 1893. The city is named after W. C. Catron, who was an early settler in the area.
Geography of Catron
Catron covers a total area of about 0.37 square miles (0.96 km2). All of this area is land, meaning there are no lakes or rivers within the city limits.
Population and People
| Historical population | |||
|---|---|---|---|
| Census | Pop. | %± | |
| 1930 | 152 | — | |
| 1940 | 259 | 70.4% | |
| 1950 | 278 | 7.3% | |
| 1960 | 177 | −36.3% | |
| 1970 | 122 | −31.1% | |
| 1980 | 180 | 47.5% | |
| 1990 | 81 | −55.0% | |
| 2000 | 68 | −16.0% | |
| 2010 | 67 | −1.5% | |
| 2020 | 41 | −38.8% | |
| U.S. Decennial Census | |||
Catron's Population in 2010
In 2010, the city of Catron had 67 people. These people lived in 28 different homes, and 17 of these were families.
The city had about 181 people per square mile. There were 32 housing units, which means places where people could live.
Most of the people in Catron were White (about 83.58%). About 14.93% were Black or African American. A small number (1.49%) were from two or more racial backgrounds.
Households and Families
Out of the 28 homes in Catron:
- About 28.6% had children under 18 living there.
- Nearly 43% were married couples living together.
- About 7% were homes where a mother lived with her children, but no husband was present.
- About 11% were homes where a father lived with his children, but no wife was present.
- About 39% were not families, meaning individuals or unrelated people living together.
About 25% of all homes had just one person living there. Also, about 18% of homes had someone living alone who was 65 years old or older. On average, each home had about 2.39 people, and each family had about 2.94 people.
Age and Gender
The average age of people in Catron in 2010 was 46.5 years old.
- About 25.4% of residents were under 18 years old.
- About 6.1% were between 18 and 24 years old.
- About 18% were between 25 and 44 years old.
- About 35.9% were between 45 and 64 years old.
- About 14.9% were 65 years old or older.
When it came to gender, about 55.2% of the people in Catron were male, and 44.8% were female.
See also
 In Spanish: Catron (Misuri) para niños
 | Janet Taylor Pickett |
 | Synthia Saint James |
 | Howardena Pindell |
 | Faith Ringgold |

