Claremont, South Dakota facts for kids
Quick facts for kids
Claremont, South Dakota
|
|
|---|---|

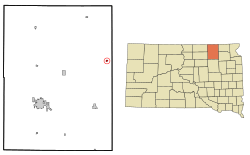
Location in Brown County and the state of South Dakota
|
|
| Country | United States |
| State | South Dakota |
| County | Brown |
| Incorporated | 1903 |
| Area | |
| • Total | 0.26 sq mi (0.66 km2) |
| • Land | 0.25 sq mi (0.65 km2) |
| • Water | 0.01 sq mi (0.01 km2) |
| Elevation | 1,299 ft (396 m) |
| Population
(2020)
|
|
| • Total | 108 |
| • Density | 430.28/sq mi (166.17/km2) |
| Time zone | UTC-6 (Central (CST)) |
| • Summer (DST) | UTC-5 (CDT) |
| ZIP code |
57432
|
| Area code(s) | 605 |
| FIPS code | 46-12100 |
| GNIS feature ID | 1267329 |
Claremont is a small town in Brown County, South Dakota, United States. It is located in the northeastern part of the state. In 2020, the town had a population of 108 people.
Claremont officially became a town in 1903. Before that, it had its own post office starting in 1887. The town's name likely comes from Claremont, New Hampshire, another place in the United States.
Contents
About Claremont's Location
Claremont is a small town in terms of size. According to the United States Census Bureau, the town covers a total area of about 0.26 square miles (0.66 square kilometers). Most of this area, about 0.25 square miles (0.65 square kilometers), is land. A very small part, about 0.01 square miles (0.01 square kilometers), is water.
How Many People Live in Claremont?
Claremont's population has changed over the years. Here's a look at how many people have lived there during different census counts:
| Historical population | |||
|---|---|---|---|
| Census | Pop. | %± | |
| 1890 | 121 | — | |
| 1900 | 120 | −0.8% | |
| 1910 | 294 | 145.0% | |
| 1920 | 290 | −1.4% | |
| 1930 | 285 | −1.7% | |
| 1940 | 271 | −4.9% | |
| 1950 | 236 | −12.9% | |
| 1960 | 247 | 4.7% | |
| 1970 | 214 | −13.4% | |
| 1980 | 180 | −15.9% | |
| 1990 | 135 | −25.0% | |
| 2000 | 130 | −3.7% | |
| 2010 | 127 | −2.3% | |
| 2020 | 108 | −15.0% | |
| U.S. Decennial Census 2017 Estimate |
|||
Claremont's Population in 2010
In 2010, the census showed that 127 people lived in Claremont. These people lived in 53 different homes, and 32 of these were families. The town had about 508 people per square mile (196 people per square kilometer). There were 61 housing units in total.
Most of the people living in Claremont in 2010 were White (99.2%). A small number (0.8%) were from two or more racial backgrounds.
About 32.1% of homes had children under 18 living there. Nearly half (45.3%) were married couples. Some homes had a single parent, either a mother (7.5%) or a father (7.5%). About 39.6% of homes were not families.
Around 32.1% of all homes had only one person living in them. About 20.8% of homes had someone aged 65 or older living alone. The average number of people in each home was 2.40. For families, the average was 3.03 people.
The average age of people in Claremont in 2010 was 40.3 years. About 26.8% of residents were under 18. About 6.3% were between 18 and 24. People aged 25 to 44 made up 22.8% of the population. Another 22.8% were between 45 and 64. Finally, 21.3% were 65 years old or older. The town had slightly more females (51.2%) than males (48.8%).
See also
 In Spanish: Claremont (Dakota del Sur) para niños

