Classification chart facts for kids

A classification chart or classification tree is like a special map that helps us organize and understand information. It shows how different things are connected and grouped together, making it easier to see the big picture. Imagine sorting your toys by type, color, or size – a classification chart does something similar for ideas, objects, or living things!
What is Classification?
Classification is how we sort and group things. It helps us recognize, tell apart, and understand different ideas or objects. Classification charts are tools that help us see these groups clearly.
A classification chart arranges facts or data so you can easily see how each part relates to the others. It helps you understand a "whole" by looking at its "parts." To make a good chart, you first need to gather and organize your information carefully.
Famous Classification Charts
People have been using classification charts for a long time. Here are some important early examples:
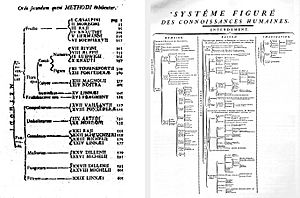
- In 1735, Carl Linnaeus created a famous system for classifying animals. He also classified plants in his book Classes Plantarum in 1738.
- In 1752, Jean le Rond d'Alembert and Denis Diderot made a "figurative system of human knowledge." This chart showed how all knowledge was connected for their Encyclopédie.
- Augustin Augier created an "Arbre Botanique" (Botanical Tree) in 1801.
- In 1840, Edward Hitchcock included a chart in his Elementary Geology. It showed a branching diagram of plants and animals over geological time.
- The famous "tree of life" image appeared in Charles Darwin's book On the Origin of Species in 1859. This chart showed how all living things are related.
Early classification charts often looked like trees with branches. Today, these charts can also be shown as tables or as fun infographics. The term "classification chart" became common in the 1900s.
See also
 In Spanish: Cuadro sinóptico para niños
- Chart
- Decision tree
- Decision tree learning
- Phylogenetic trees
- Tree of life (biology)
- Tree structure
 | Bayard Rustin |
 | Jeannette Carter |
 | Jeremiah A. Brown |

