Clayville, New York facts for kids
Quick facts for kids
Clayville, New York
|
|
|---|---|
|
Village
|
|

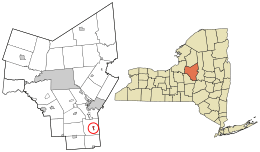
Location in Oneida County and the state of New York.
|
|
| Country | United States |
| State | New York |
| County | Oneida |
| Town | Paris |
| Area | |
| • Total | 0.44 sq mi (1.15 km2) |
| • Land | 0.44 sq mi (1.14 km2) |
| • Water | 0.00 sq mi (0.01 km2) |
| Elevation | 984 ft (300 m) |
| Population
(2020)
|
|
| • Total | 339 |
| • Density | 772.21/sq mi (298.06/km2) |
| Time zone | UTC-5 (Eastern (EST)) |
| • Summer (DST) | UTC-4 (EDT) |
| ZIP code |
13322
|
| Area code(s) | 315 |
| FIPS code | 36-16111 |
| GNIS feature ID | 2391610 |
Clayville is a small village located in Oneida County, New York, in the United States. In 2020, about 339 people lived there.
This village was once known as Paris Furnace. It is part of the larger town of Paris.
Contents
Discover Clayville's Past
Clayville became an official village in 1887. It was named after Henry Clay, a famous American statesman. In the 1850s, a lot of important work happened here. Factories that made iron (called iron foundries) and places that fixed machines (machine shops) were very active.
Where is Clayville?
Clayville is a small place. According to the United States Census Bureau, the village covers about 0.5 square miles (1.3 km2) of land. A very small part, about 2.13%, is water.
How Many People Live in Clayville?
| Historical population | |||
|---|---|---|---|
| Census | Pop. | %± | |
| 1870 | 944 | — | |
| 1880 | 847 | −10.3% | |
| 1890 | 843 | −0.5% | |
| 1900 | 568 | −32.6% | |
| 1910 | 649 | 14.3% | |
| 1920 | 990 | 52.5% | |
| 1930 | 801 | −19.1% | |
| 1940 | 711 | −11.2% | |
| 1950 | 719 | 1.1% | |
| 1960 | 686 | −4.6% | |
| 1970 | 535 | −22.0% | |
| 1980 | 478 | −10.7% | |
| 1990 | 463 | −3.1% | |
| 2000 | 445 | −3.9% | |
| 2010 | 350 | −21.3% | |
| 2020 | 339 | −3.1% | |
| U.S. Decennial Census | |||
In 2000, there were 445 people living in Clayville. These people lived in 168 homes. Most of the people living in the village were White.
About 38% of the homes had children under 18 living there. The average home had about 2.65 people. The average family had about 3.37 people.
The village population included people of all ages. About 30% were under 18 years old. The average age of people in Clayville was 34 years.
Learn More

- In Spanish: Clayville para niños

