Coalmont, Pennsylvania facts for kids
Quick facts for kids
Coalmont, Pennsylvania
|
|
|---|---|
|
Borough
|
|

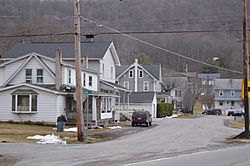
Scene along Barnett Road
|
|

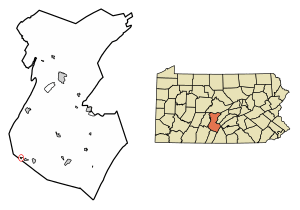
Location of Coalmont in Huntingdon County, Pennsylvania.
|
|
| Country | United States |
| State | Pennsylvania |
| County | Huntingdon |
| Government | |
| • Type | Borough Council |
| Area | |
| • Total | 0.12 sq mi (0.31 km2) |
| • Land | 0.12 sq mi (0.31 km2) |
| • Water | 0.00 sq mi (0.00 km2) |
| Elevation | 1,106 ft (337 m) |
| Population
(2020)
|
|
| • Total | 90 |
| • Density | 750.00/sq mi (289.69/km2) |
| Time zone | UTC-5 (Eastern (EST)) |
| • Summer (DST) | UTC-4 (EDT) |
| ZIP code |
16678
|
| Area code(s) | 814 |
| FIPS code | 42-14640 |
| GNIS feature ID | 1215268 |
| Local phone exchanges: 635 | |
Coalmont is a small town, called a borough, in Huntingdon County, Pennsylvania, United States. In 2020, about 91 people lived there. It's a quiet place located in a valley.
Contents
Where is Coalmont?
Coalmont is located in Pennsylvania, near the bottom left part of Huntingdon County. It sits in a valley next to a stream called Shoup Run. This stream flows into a bigger river branch, the Raystown Branch Juniata River.
A main road, Pennsylvania Route 913, goes right through the middle of Coalmont. If you go east on this road for about 2 miles (3 km), you'll reach a town called Dudley. If you go west for about 4 miles (6 km), you'll find Saxton.
Coalmont is a very small place. It covers an area of only about 0.1 square miles (0.26 km2), and all of it is land.
People Living in Coalmont
This section shares information about the people who live in Coalmont. This data comes from official counts of the population, called a census.
Population Over Time
The number of people living in Coalmont has changed over many years. Here's a look at how the population has grown or shrunk:
| Historical population | |||
|---|---|---|---|
| Census | Pop. | %± | |
| 1870 | 189 | — | |
| 1880 | 171 | −9.5% | |
| 1890 | 219 | 28.1% | |
| 1900 | 182 | −16.9% | |
| 1910 | 228 | 25.3% | |
| 1920 | 220 | −3.5% | |
| 1930 | 159 | −27.7% | |
| 1940 | 162 | 1.9% | |
| 1950 | 207 | 27.8% | |
| 1960 | 172 | −16.9% | |
| 1970 | 129 | −25.0% | |
| 1980 | 128 | −0.8% | |
| 1990 | 109 | −14.8% | |
| 2000 | 128 | 17.4% | |
| 2010 | 106 | −17.2% | |
| 2020 | 91 | −14.2% | |
| 2021 (est.) | 90 | −15.1% | |
| Sources: | |||
Life in Coalmont (2000 Census)
In the year 2000, there were 128 people living in Coalmont. These people lived in 50 different homes, and 37 of those homes were families.
- About 42% of the homes had children under 18 living there.
- Most homes (64%) were married couples living together.
- About 26% of all homes were single people or groups of friends living together, not families.
- About 18% of homes had someone living alone who was 65 years old or older.
The average home had about 2.56 people, and the average family had about 3.08 people.
Age Groups in Coalmont (2000 Census)
The people in Coalmont were of different ages:
- Almost 29% were under 18 years old.
- A small group, about 1.6%, were between 18 and 24 years old.
- The largest group, about 36.7%, were between 25 and 44 years old.
- About 21% were between 45 and 64 years old.
- About 11.7% were 65 years old or older.
The average age of people in Coalmont was 35 years. For every 100 females, there were about 94 males. For every 100 females aged 18 and over, there were about 107 males.
Money and Income (2000 Census)
In 2000, the average yearly income for a home in Coalmont was $38,750. For families, the average income was $52,917.
- Men earned an average of $30,625 per year.
- Women earned an average of $28,750 per year.
- The average income per person in the borough was $15,260.
About 5.1% of families and 7.6% of all people in Coalmont lived below the poverty line. This included about 11.4% of children under 18.
See also
 In Spanish: Coalmont (Pensilvania) para niños


