Coalmont, Tennessee facts for kids
Quick facts for kids
Coalmont, Tennessee
|
|
|---|---|

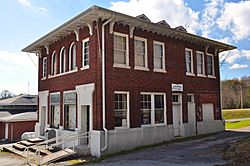
The historic Coalmont Bank Building serves as the Coalmont City Hall and Public Library.
|
|

Location of Coalmont in Grundy County, Tennessee.
|
|
| Country | United States |
| State | Tennessee |
| County | Grundy |
| Area | |
| • Total | 6.19 sq mi (16.04 km2) |
| • Land | 6.06 sq mi (15.69 km2) |
| • Water | 0.14 sq mi (0.35 km2) |
| Elevation | 1,883 ft (574 m) |
| Population
(2020)
|
|
| • Total | 784 |
| • Density | 129.44/sq mi (49.98/km2) |
| Time zone | UTC-6 (Central (CST)) |
| • Summer (DST) | UTC-5 (CDT) |
| ZIP code |
37313
|
| Area code(s) | 931 |
| FIPS code | 47-15920 |
| GNIS feature ID | 1306006 |
Coalmont is a small city in Grundy County, Tennessee, United States. It was first started in 1904. The city covers an area of about 6 square miles. In 2020, the population was 784 people.
Contents
History of Coalmont
Coalmont began as a special kind of town called a company town around 1904. It was built by the Sewanee Coal, Coke and Land Company. This company was involved in coal mining. The company owned most of the houses and businesses in Coalmont. However, individual miners could also build their own homes.
Some old structures from Coalmont's early days are still important. A group of coke ovens from the early 1900s is listed on the National Register of Historic Places. This means they are protected because of their historical value. The old Coalmont Bank Building is also on this list.
Geography and Location
Coalmont is located at 35°20′40″N 85°43′2″W / 35.34444°N 85.71722°W. This is in the central part of Tennessee.
The United States Census Bureau says that Coalmont has a total area of about 6.1 square miles (16.04 square kilometers). Most of this area, about 5.9 square miles (15.69 square kilometers), is land. A small part, about 0.1 square miles (0.35 square kilometers), is water.
Population and People
| Historical population | |||
|---|---|---|---|
| Census | Pop. | %± | |
| 1960 | 458 | — | |
| 1970 | 518 | 13.1% | |
| 1980 | 625 | 20.7% | |
| 1990 | 813 | 30.1% | |
| 2000 | 948 | 16.6% | |
| 2010 | 841 | −11.3% | |
| 2020 | 784 | −6.8% | |
| Sources: | |||
2020 Census Information
The 2020 United States census counted 784 people living in Coalmont. There were 308 households and 209 families.
Here is a breakdown of the different groups of people living in Coalmont in 2020:
| Race | Number | Percentage |
|---|---|---|
| White (non-Hispanic) | 754 | 96.17% |
| Black or African American (non-Hispanic) | 5 | 0.64% |
| Native American | 2 | 0.26% |
| Other/Mixed | 19 | 2.42% |
| Hispanic or Latino | 4 | 0.51% |
See also
 In Spanish: Coalmont (Tennessee) para niños
 | Roy Wilkins |
 | John Lewis |
 | Linda Carol Brown |

