Danville, Kansas facts for kids
Quick facts for kids
Danville, Kansas
|
|
|---|---|

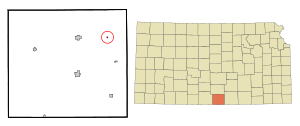
Location within Harper County and Kansas
|
|

|
|
| Country | United States |
| State | Kansas |
| County | Harper |
| Founded | 1880s |
| Platted | 1880 |
| Incorporated | 1926 |
| Named for | Danville, Ohio |
| Area | |
| • Total | 0.08 sq mi (0.21 km2) |
| • Land | 0.08 sq mi (0.21 km2) |
| • Water | 0.00 sq mi (0.00 km2) |
| Elevation | 1,342 ft (409 m) |
| Population
(2020)
|
|
| • Total | 29 |
| • Density | 363/sq mi (138/km2) |
| Time zone | UTC-6 (CST) |
| • Summer (DST) | UTC-5 (CDT) |
| ZIP code |
67036
|
| Area code | 620 |
| FIPS code | 20-17000 |
| GNIS ID | 2393717 |
Danville is a small city located in Harper County, Kansas, in the United States. It's a quiet place with a small population. In 2020, only 29 people lived there.
Contents
History of Danville
Danville has had a few different names over the years! It was first called Odell. Then, in 1881, its name changed to Coleville. Mrs. J. E. Cole planned out the town in 1880. Later, when Mrs. Cole sold the land where the town was built, the name changed again. It became Danville, named after a town called Danville, Ohio.
Geography of Danville
Danville is a very compact city. It covers a total area of about 0.08 square miles (0.21 square kilometers). All of this area is land, meaning there are no lakes or large rivers within the city limits.
Population Changes in Danville
The number of people living in Danville has changed quite a bit over the years. Here’s a look at how the population has grown and shrunk:
| Historical population | |||
|---|---|---|---|
| Census | Pop. | %± | |
| 1930 | 130 | — | |
| 1940 | 134 | 3.1% | |
| 1950 | 122 | −9.0% | |
| 1960 | 118 | −3.3% | |
| 1970 | 80 | −32.2% | |
| 1980 | 71 | −11.2% | |
| 1990 | 56 | −21.1% | |
| 2000 | 59 | 5.4% | |
| 2010 | 38 | −35.6% | |
| 2020 | 29 | −23.7% | |
| U.S. Decennial Census | |||
Danville's Population in 2020
The 2020 United States census counted 29 people living in Danville. These people made up 13 households, with 11 of them being families. Most people living in Danville were white. About 17% of the population identified as being from two or more races. A small number, about 10%, were of Hispanic or Latino background.
Many households, about 61.5%, had children under 18 living there. Most families, about 77%, were married couples. The average household had about 2 people. The average family had about 2.3 people.
The ages of people in Danville varied. About 34.5% of the population was under 18 years old. Another 34.5% were between 45 and 64 years old. About 20.7% of the people were 65 years or older. The median age, which is the middle age of everyone, was 50.5 years.
Danville's Population in 2010
Back in 2010, the census showed there were 38 people in Danville. There were 19 households in the city. The population density was about 475 people per square mile. All of the residents identified as White.
About 16% of households had children under 18. About 32% were married couples living together. Many households, about 42%, were made up of single individuals. About 10.5% of households had someone living alone who was 65 or older. The average household size was 2 people.
The median age in 2010 was 47.5 years. About 21% of residents were under 18. About 24% were between 25 and 44. The largest group, about 37%, was between 45 and 64 years old. About 16% were 65 or older.
Education in Danville
Students in Danville attend schools in the Chaparral USD 361 public school district. This district serves the community and provides education for local children.
More About Danville
- Danville - Directory of Public Officials: https://www.lkm.org/members/?id=41260640
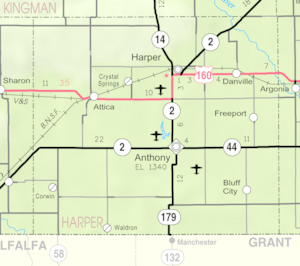
- Danville city map, KDOT
See also
 In Spanish: Danville (Kansas) para niños
 | John T. Biggers |
 | Thomas Blackshear |
 | Mark Bradford |
 | Beverly Buchanan |

