Ericson, Nebraska facts for kids
Quick facts for kids
Ericson, Nebraska
|
|
|---|---|
|
Village
|
|

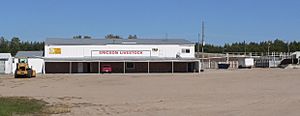
Ericson-Spalding Livestock Market in Ericson
|
|

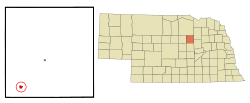
Location of Ericson, Nebraska
|
|
| Country | United States |
| State | Nebraska |
| County | Wheeler |
| Area | |
| • Total | 0.38 sq mi (0.97 km2) |
| • Land | 0.38 sq mi (0.97 km2) |
| • Water | 0.00 sq mi (0.00 km2) |
| Elevation | 2,028 ft (618 m) |
| Population
(2020)
|
|
| • Total | 89 |
| • Density | 237.33/sq mi (91.70/km2) |
| Time zone | UTC-6 (Central (CST)) |
| • Summer (DST) | UTC-5 (CDT) |
| ZIP code |
68637
|
| Area code(s) | 308 |
| FIPS code | 31-16025 |
| GNIS feature ID | 2398839 |
Ericson is a small village located in Wheeler County, Nebraska, in the United States. In 2020, about 89 people lived there. It's a quiet place with a rich history.
Contents
A Look Back in Time
Ericson was officially planned and marked out in 1886. This happened when the C. B. & Q. railroad company extended its train line to this spot. The village was named after Christensen Erickson, who owned the land where the town was built.
At first, Ericson grew very slowly. The first train station agent, a man named Dahl, did many jobs to help the town survive. He bought grain, sold coal, and even took over the local store. His efforts helped keep the village going in its early days.
Where Ericson Is Located
Ericson is in the state of Nebraska. The United States Census Bureau says the village covers about 0.38 square miles (0.97 square kilometers). All of this area is land, with no lakes or rivers inside the village limits.
Ericson's Weather
Ericson has a type of weather called a "hot-summer humid continental climate." This means it has warm, humid summers and cold winters. On climate maps, this is shown as "Dfa."
The hottest temperature ever recorded in Ericson was 111°F (44°C) on July 26, 2012. The coldest temperature ever was -35°F (-37°C) on February 15–16, 2021.
| Climate data for Ericson, Nebraska, 1991–2020 normals, extremes 1984–present | |||||||||||||
|---|---|---|---|---|---|---|---|---|---|---|---|---|---|
| Month | Jan | Feb | Mar | Apr | May | Jun | Jul | Aug | Sep | Oct | Nov | Dec | Year |
| Record high °F (°C) | 71 (22) |
79 (26) |
86 (30) |
91 (33) |
100 (38) |
106 (41) |
111 (44) |
106 (41) |
101 (38) |
98 (37) |
85 (29) |
70 (21) |
111 (44) |
| Mean maximum °F (°C) | 59.3 (15.2) |
63.7 (17.6) |
75.9 (24.4) |
83.6 (28.7) |
89.2 (31.8) |
93.6 (34.2) |
98.1 (36.7) |
96.4 (35.8) |
91.8 (33.2) |
85.1 (29.5) |
73.8 (23.2) |
61.0 (16.1) |
99.6 (37.6) |
| Mean daily maximum °F (°C) | 34.3 (1.3) |
37.7 (3.2) |
49.3 (9.6) |
59.2 (15.1) |
69.4 (20.8) |
79.9 (26.6) |
85.7 (29.8) |
83.6 (28.7) |
76.4 (24.7) |
63.1 (17.3) |
48.7 (9.3) |
37.0 (2.8) |
60.4 (15.8) |
| Daily mean °F (°C) | 22.6 (−5.2) |
26.0 (−3.3) |
36.3 (2.4) |
46.3 (7.9) |
57.1 (13.9) |
67.8 (19.9) |
73.3 (22.9) |
71.2 (21.8) |
62.7 (17.1) |
49.1 (9.5) |
35.8 (2.1) |
25.7 (−3.5) |
47.8 (8.8) |
| Mean daily minimum °F (°C) | 11.0 (−11.7) |
14.2 (−9.9) |
23.3 (−4.8) |
33.4 (0.8) |
44.8 (7.1) |
55.7 (13.2) |
60.9 (16.1) |
58.8 (14.9) |
49.1 (9.5) |
35.2 (1.8) |
23.0 (−5.0) |
14.4 (−9.8) |
35.3 (1.9) |
| Mean minimum °F (°C) | −11.6 (−24.2) |
−6.0 (−21.1) |
3.6 (−15.8) |
17.5 (−8.1) |
29.9 (−1.2) |
42.7 (5.9) |
50.1 (10.1) |
46.5 (8.1) |
34.2 (1.2) |
19.2 (−7.1) |
5.4 (−14.8) |
−6.2 (−21.2) |
−16.7 (−27.1) |
| Record low °F (°C) | −34 (−37) |
−35 (−37) |
−18 (−28) |
0 (−18) |
21 (−6) |
32 (0) |
40 (4) |
37 (3) |
25 (−4) |
6 (−14) |
−14 (−26) |
−32 (−36) |
−35 (−37) |
| Average precipitation inches (mm) | 0.52 (13) |
0.65 (17) |
1.48 (38) |
2.73 (69) |
3.97 (101) |
4.17 (106) |
3.59 (91) |
3.22 (82) |
2.37 (60) |
2.15 (55) |
1.01 (26) |
0.69 (18) |
26.55 (676) |
| Average snowfall inches (cm) | 4.8 (12) |
6.2 (16) |
3.7 (9.4) |
3.0 (7.6) |
0.0 (0.0) |
0.0 (0.0) |
0.0 (0.0) |
0.0 (0.0) |
0.0 (0.0) |
1.3 (3.3) |
4.2 (11) |
4.5 (11) |
27.7 (70.3) |
| Average precipitation days (≥ 0.01 in) | 3.7 | 3.9 | 6.2 | 8.6 | 11.1 | 9.8 | 8.9 | 8.1 | 6.2 | 6.4 | 3.9 | 3.6 | 80.4 |
| Average snowy days (≥ 0.1 in) | 2.1 | 2.9 | 1.8 | 1.0 | 0.0 | 0.0 | 0.0 | 0.0 | 0.0 | 0.4 | 1.4 | 2.1 | 11.7 |
| Source 1: NOAA | |||||||||||||
| Source 2: National Weather Service | |||||||||||||
Who Lives in Ericson?
| Historical population | |||
|---|---|---|---|
| Census | Pop. | %± | |
| 1920 | 192 | — | |
| 1930 | 272 | 41.7% | |
| 1940 | 279 | 2.6% | |
| 1950 | 186 | −33.3% | |
| 1960 | 157 | −15.6% | |
| 1970 | 122 | −22.3% | |
| 1980 | 132 | 8.2% | |
| 1990 | 111 | −15.9% | |
| 2000 | 104 | −6.3% | |
| 2010 | 92 | −11.5% | |
| 2020 | 89 | −3.3% | |
| U.S. Decennial Census | |||
The number of people living in Ericson has changed over the years. You can see how the population has grown and shrunk from 1920 to 2020 in the chart above.
The 2010 Census
In 2010, a census (a count of all people) showed that 92 people lived in Ericson. These people lived in 51 different homes, and 29 of these were families. The village had about 242 people per square mile.
Most of the people living in Ericson at that time were White (100%).
- About 13.7% of homes had children under 18.
- More than half (54.9%) of the homes were married couples living together.
- About 39.2% of all homes had just one person living there.
- Many people (27.4%) living alone were 65 years old or older.
The average age of people in Ericson in 2010 was 62 years old.
- 12% of residents were under 18.
- 12% were between 25 and 44 years old.
- 33.7% were between 45 and 64 years old.
- 42.4% were 65 years old or older.
The village had an equal number of males and females, with 50% male and 50% female residents.
See also
 In Spanish: Ericson (Nebraska) para niños
 | Aurelia Browder |
 | Nannie Helen Burroughs |
 | Michelle Alexander |

