Flovilla, Georgia facts for kids
Quick facts for kids
Flovilla, Georgia
|
||
|---|---|---|
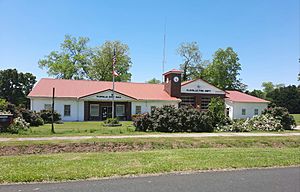
Flovilla City Hall
|
||
|
||
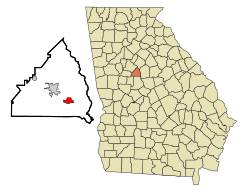
Location in Butts County and the state of Georgia
|
||
| Country | United States | |
| State | Georgia | |
| County | Butts | |
| Area | ||
| • Total | 1.96 sq mi (5.07 km2) | |
| • Land | 1.96 sq mi (5.07 km2) | |
| • Water | 0.00 sq mi (0.00 km2) | |
| Elevation | 541 ft (165 m) | |
| Population
(2020)
|
||
| • Total | 643 | |
| • Density | 328.40/sq mi (126.80/km2) | |
| Time zone | UTC-5 (Eastern (EST)) | |
| • Summer (DST) | UTC-4 (EDT) | |
| ZIP code |
30216
|
|
| Area code(s) | 770 | |
| FIPS code | 13-30312 | |
| GNIS feature ID | 0355853 | |
Flovilla is a small city located in Butts County, Georgia, in the United States. In 2020, about 643 people lived there. It's also close to the beautiful Indian Springs State Park.
Contents
History of Flovilla
Flovilla became an official city in 1885. When a place "incorporates," it means it gets its own local government. Its name, Flovilla, was created to mean "village of flowers," which sounds lovely!
Geography and Location
Flovilla is found in the southeastern part of Butts County. A main road, U.S. Route 23, goes right through the middle of the city. This road can take you about 5 miles (8 km) northwest to Jackson, which is the county seat. It also goes southeast about 34 miles (55 km) to Macon.
Nearby Attractions
Just 2 miles (3 km) west of Flovilla is Indian Springs State Park. This park is famous for its natural springs, which give it its name. It also has a lake and a campground where people can enjoy nature.
The city of Flovilla covers an area of about 1.96 square miles (5.1 square kilometers). All of this area is land, with no large bodies of water inside the city limits.
Population Changes Over Time
The number of people living in Flovilla has changed quite a bit over the years. Here's a look at how the population has grown and shrunk since 1890:
| Historical population | |||
|---|---|---|---|
| Census | Pop. | %± | |
| 1890 | 422 | — | |
| 1900 | 523 | 23.9% | |
| 1910 | 495 | −5.4% | |
| 1920 | 371 | −25.1% | |
| 1930 | 230 | −38.0% | |
| 1940 | 240 | 4.3% | |
| 1950 | 315 | 31.3% | |
| 1960 | 284 | −9.8% | |
| 1970 | 289 | 1.8% | |
| 1980 | 458 | 58.5% | |
| 1990 | 602 | 31.4% | |
| 2000 | 652 | 8.3% | |
| 2010 | 653 | 0.2% | |
| 2020 | 643 | −1.5% | |
| U.S. Decennial Census | |||
In 2010, the city had 653 residents. By the 2020 census, the population was 643 people.
See also
 In Spanish: Flovilla para niños
 | Charles R. Drew |
 | Benjamin Banneker |
 | Jane C. Wright |
 | Roger Arliner Young |

