Forestville, Michigan facts for kids
Quick facts for kids
Forestville, Michigan
|
|
|---|---|
|
Village
|
|

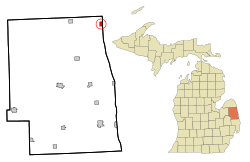
Location of Forestville, Michigan
|
|
| Country | United States |
| State | Michigan |
| County | Sanilac |
| Area | |
| • Total | 0.79 sq mi (2.06 km2) |
| • Land | 0.79 sq mi (2.06 km2) |
| • Water | 0.00 sq mi (0.00 km2) |
| Elevation | 633 ft (193 m) |
| Population
(2020)
|
|
| • Total | 104 |
| • Density | 130.98/sq mi (50.56/km2) |
| Time zone | UTC-5 (Eastern (EST)) |
| • Summer (DST) | UTC-4 (EDT) |
| ZIP code |
48434
|
| Area code(s) | 989 |
| FIPS code | 26-29660 |
| GNIS feature ID | 0626287 |
Forestville is a small village located in Sanilac County, in the U.S. state of Michigan. In 2020, only 104 people lived there. This makes it the village with the fewest people in all of Michigan! Even though it's on Lake Huron, it doesn't have a big boat harbor. But it does have a place where you can launch a boat. Forestville gets its water from the nearby town of Harbor Beach. The village is part of Delaware Township.
Contents
About Forestville's Location
Forestville is a small place. According to the United States Census Bureau, the village covers about 0.79 square miles (2.06 square kilometers). All of this area is land, with no large bodies of water inside the village limits.
Forestville's Past: A Brief History
Forestville started to grow in 1854. That's when a sawmill was built there. A sawmill is a factory that cuts logs into lumber. The village got its first post office in 1856. This is where people could send and receive mail. Later, in 1895, Forestville officially became a village. This means it got its own local government.
Who Lives in Forestville?
The number of people living in Forestville has changed over the years. Here's a quick look at how the population has grown and shrunk:
| Historical population | |||
|---|---|---|---|
| Census | Pop. | %± | |
| 1870 | 121 | — | |
| 1880 | 192 | 58.7% | |
| 1900 | 282 | — | |
| 1910 | 234 | −17.0% | |
| 1920 | 140 | −40.2% | |
| 1930 | 74 | −47.1% | |
| 1940 | 156 | 110.8% | |
| 1950 | 124 | −20.5% | |
| 1960 | 121 | −2.4% | |
| 1970 | 110 | −9.1% | |
| 1980 | 159 | 44.5% | |
| 1990 | 153 | −3.8% | |
| 2000 | 127 | −17.0% | |
| 2010 | 136 | 7.1% | |
| 2020 | 104 | −23.5% | |
| U.S. Decennial Census | |||
Looking at the 2010 Census
In 2010, there were 136 people living in Forestville. They lived in 58 different homes. About 36 of these were families. The village had about 172 people per square mile. Most of the people (97.1%) were White. A small number were Native American or from other backgrounds. About 5.1% of the people were Hispanic or Latino.
In the homes, about 17.2% had kids under 18 living there. More than half (58.6%) were married couples. About 37.9% of all homes had just one person living in them. And 15.5% of homes had someone 65 years or older living alone. The average home had 2.34 people. The average family had 3.11 people.
The average age of people in Forestville was 55.5 years old. About 17.6% of residents were under 18. Many people (38.1%) were between 45 and 64 years old. About 25% were 65 or older. The village had a nearly even number of males and females. About 50.7% were male and 49.3% were female.
See also
 In Spanish: Forestville (Míchigan) para niños

