Gällivare Municipality facts for kids
Quick facts for kids
Gällivare Municipality
Gällivare kommun
|
||
|---|---|---|

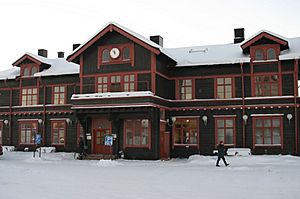
Gällivare Railway Station
|
||
|
||
 |
||
| Country | Sweden | |
| County | Norrbotten County | |
| Seat | Gällivare | |
| Area | ||
| • Total | 16,950.53 km2 (6,544.64 sq mi) | |
| • Land | 15,825.22 km2 (6,110.15 sq mi) | |
| • Water | 1,125.31 km2 (434.48 sq mi) | |
| Area as of January 1, 2010. | ||
| Population
(June 30, 2012)
|
||
| • Total | 18,484 | |
| • Density | 1.090467/km2 (2.82430/sq mi) | |
| Time zone | UTC+1 (CET) | |
| • Summer (DST) | UTC+2 (CEST) | |
| ISO 3166 code | SE | |
| Province | Lapland | |
| Municipal code | 2523 | |
| Website | www.gellivare.se | |
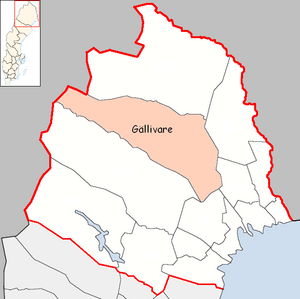
Gällivare Municipality is a large area in northern Sweden. It is part of Norrbotten County. The main town, or seat, is Gällivare. This municipality is the third largest in all of Sweden!
It's a popular place for hikers because it's close to amazing national parks like Sarek and Padjelanta. The Gällivare Lapland Airport helps people get there.
| Top - 0-9 A B C D E F G H I J K L M N O P Q R S T U V W X Y Z |
Towns and Villages in Gällivare
Gällivare Municipality has several towns and villages. These are called localities or urban areas.
| # | Locality | Population |
|---|---|---|
| 1 | Gällivare | 8,480 |
| 2 | Malmberget | 6,017 |
| 3 | Koskullskulle | 899 |
| 4 | Hakkas | 383 |
| 5 | Ullatti | 230 |
| 6 | Tjautjas/Čavččas | 216 |
The main town, Gällivare, is shown in bold.
Other Small Settlements
Besides the main towns, there are also smaller places where people live:
- Flakaberg
- Kääntöjärvi
- Sangervaara
Who Lives in Gällivare?
The municipality is home to about 17,434 people. Many people work in the mining industry here. This means that the average income in Gällivare is quite good compared to other places in the region.
People from different backgrounds live here. About 85% of the people have Swedish parents. The other 15% were either born in another country or have two parents who were born abroad.
How People Vote in Gällivare
People in Gällivare Municipality vote in elections for the Swedish Parliament. The voting results show how people in Gällivare have chosen their leaders over the years.
For example, in the 2022 Swedish general election, about 53% of voters supported parties on the left side of politics, and 45.8% supported parties on the right side. This shows how the community's political views are split.
Friends Around the World: Sister Cities
Gällivare Municipality has special friendships with four other cities around the world. These are called sister cities or twin towns. They work together on cultural projects and learn from each other.
Images for kids
 | Laphonza Butler |
 | Daisy Bates |
 | Elizabeth Piper Ensley |


