Glenmont, Ohio facts for kids
Quick facts for kids
Glenmont, Ohio
|
|
|---|---|
|
Village
|
|

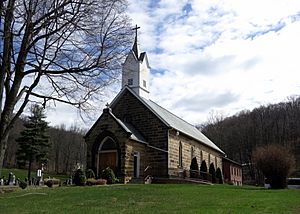
SS Peter and Paul Church
|
|

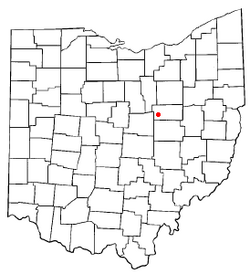
Location of Glenmont, Ohio
|
|

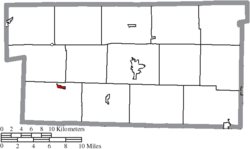
Location of Glenmont in Holmes County
|
|
| Country | United States |
| State | Ohio |
| County | Holmes |
| Township | Richland |
| Area | |
| • Total | 0.28 sq mi (0.71 km2) |
| • Land | 0.28 sq mi (0.71 km2) |
| • Water | 0.00 sq mi (0.00 km2) |
| Elevation | 1,027 ft (313 m) |
| Population
(2020)
|
|
| • Total | 240 |
| • Estimate
(2023)
|
238 |
| • Density | 872.73/sq mi (336.81/km2) |
| Time zone | UTC-5 (Eastern (EST)) |
| • Summer (DST) | UTC-4 (EDT) |
| ZIP code |
44628
|
| Area code(s) | 330 |
| FIPS code | 39-30506 |
| GNIS feature ID | 2398976 |
Glenmont is a small village located in Holmes County, Ohio, in the United States. In 2020, about 240 people lived there. It is a quiet community in the heart of Ohio.
Contents
History of Glenmont
Glenmont has an interesting past, especially during the American Civil War.
The Battle of Fort Fizzle
In 1863, during the Civil War, nearly 1,000 people in Glenmont protested against joining the army. This event is known as the Battle of Fort Fizzle. The Union Army had to step in to calm things down. It was a notable moment in the village's history.
Geography of Glenmont
Glenmont is a small place, covering less than one square mile.
Land Area
The United States Census Bureau says the village has a total area of about 0.27 square miles (0.71 square kilometers). All of this area is land, meaning there are no large bodies of water within the village limits.
People of Glenmont (Demographics)
Understanding the people who live in Glenmont helps us learn about the village.
Population Changes Over Time
The number of people living in Glenmont has changed over the years. Here is a look at the population from 1900 to 2020:
| Historical population | |||
|---|---|---|---|
| Census | Pop. | %± | |
| 1900 | 209 | — | |
| 1910 | 269 | 28.7% | |
| 1920 | 287 | 6.7% | |
| 1930 | 279 | −2.8% | |
| 1940 | 281 | 0.7% | |
| 1950 | 242 | −13.9% | |
| 1960 | 283 | 16.9% | |
| 1970 | 266 | −6.0% | |
| 1980 | 270 | 1.5% | |
| 1990 | 233 | −13.7% | |
| 2000 | 283 | 21.5% | |
| 2010 | 272 | −3.9% | |
| 2020 | 240 | −11.8% | |
| 2023 (est.) | 238 | −12.5% | |
| U.S. Decennial Census | |||
Who Lives in Glenmont? (2010 Census)
In 2010, there were 272 people living in Glenmont. They lived in 116 different homes.
- Most residents were White, making up about 98.2% of the population.
- A small number of people were Native American or Asian.
- About 0.4% of the population identified as Hispanic or Latino.
Households and Families
In 2010, about 29% of homes had children under 18 living there. Many homes (41.4%) were married couples living together. Some homes had a single parent, either a mother or a father. About 32.8% of all homes had just one person living in them.
The average age of people in Glenmont was about 37.8 years old. The population was almost evenly split between males (50.4%) and females (49.6%).
See also
 In Spanish: Glenmont (Ohio) para niños
 | Precious Adams |
 | Lauren Anderson |
 | Janet Collins |

