Grayson Valley, Alabama facts for kids
Quick facts for kids
Grayson Valley, Alabama
|
|
|---|---|

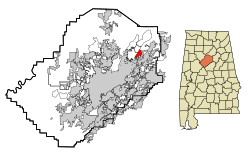
Location in Jefferson County and the state of Alabama
|
|
| Country | United States |
| State | Alabama |
| County | Jefferson |
| Area | |
| • Total | 1.91 sq mi (4.95 km2) |
| • Land | 1.91 sq mi (4.95 km2) |
| • Water | 0.00 sq mi (0.00 km2) |
| Elevation | 942 ft (287 m) |
| Population
(2020)
|
|
| • Total | 5,982 |
| • Density | 3,131.94/sq mi (1,209.32/km2) |
| Time zone | UTC-6 (Central (CST)) |
| • Summer (DST) | UTC-5 (CDT) |
| ZIP code |
35235
|
| Area code(s) | 205, 659 |
| FIPS code | 01-31348 |
| GNIS feature ID | 1852797 |
Grayson Valley is a community in Jefferson County, Alabama, United States. It's located in the northeastern part of the Birmingham area. It's known as an "unincorporated community," which means it's not officially a city or town with its own local government. It's also a "census-designated place" (CDP), which is a special area the U.S. Census Bureau defines for gathering population data.
Grayson Valley is found between the Spring Lake neighborhood of Birmingham and nearby suburbs like Clay, Trussville, and Center Point. In 2020, about 5,982 people lived there.
Population and People
Grayson Valley has grown steadily over the years. The U.S. Census helps us track how many people live in an area and what groups they belong to.
Population Growth Over Time
Here's how the population of Grayson Valley has changed:
| Historical population | |||
|---|---|---|---|
| Census | Pop. | %± | |
| 2000 | 5,441 | — | |
| 2010 | 5,736 | 5.4% | |
| 2020 | 5,982 | 4.3% | |
| U.S. Decennial Census | |||
Who Lives in Grayson Valley?
The 2020 United States census showed that 5,982 people lived in Grayson Valley. These people made up 2,598 households, with 1,718 of those being families.
The census also looks at the different groups of people living in a community. Here's a quick look at the racial makeup of Grayson Valley in 2020:
| Race | Num. | Perc. |
|---|---|---|
| White (non-Hispanic) | 2,272 | 37.98% |
| Black or African American (non-Hispanic) | 3,109 | 51.97% |
| Native American | 7 | 0.12% |
| Asian | 60 | 1.0% |
| Other/Mixed | 237 | 3.96% |
| Hispanic or Latino | 297 | 4.96% |
See also
 In Spanish: Grayson Valley (Alabama) para niños
 | James Van Der Zee |
 | Alma Thomas |
 | Ellis Wilson |
 | Margaret Taylor-Burroughs |

