Heath Springs, South Carolina facts for kids
Quick facts for kids
Heath Springs, South Carolina
|
|
|---|---|
 |
|
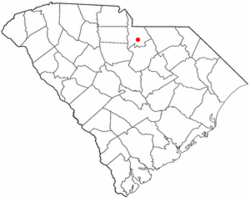
Location of Heath Springs, South Carolina
|
|
| Country | United States |
| State | South Carolina |
| County | Lancaster |
| Area | |
| • Total | 1.63 sq mi (4.21 km2) |
| • Land | 1.63 sq mi (4.21 km2) |
| • Water | 0.00 sq mi (0.00 km2) |
| Elevation | 686 ft (209 m) |
| Population
(2020)
|
|
| • Total | 742 |
| • Density | 456.62/sq mi (176.29/km2) |
| Time zone | UTC-5 (Eastern (EST)) |
| • Summer (DST) | UTC-4 (EDT) |
| ZIP code |
29058
|
| Area code(s) | 803, 839 |
| FIPS code | 45-32965 |
| GNIS feature ID | 1245936 |
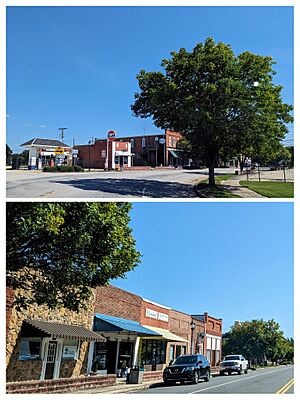
Heath Springs is a small town located in Lancaster County, South Carolina, in the United States. In 2020, a count of the people living there, called a census, showed that 742 people lived in Heath Springs.
Contents
History of Heath Springs
Heath Springs became an official town in 1890. This means it was given the power to govern itself. The town was named after a business called Heath & Springs.
Two important places in Heath Springs are listed on the National Register of Historic Places. This is a special list of buildings, sites, and objects that are important to American history. These places are the Battle of Hanging Rock Historic Site and the Heath Springs Depot.
Geography and Location
Heath Springs is located at coordinates 34 degrees, 35 minutes, 30 seconds North and 80 degrees, 40 minutes, 28 seconds West.
According to the United States Census Bureau, which collects information about the country, the town covers a total area of about 1.3 square miles (3.4 square kilometers). All of this area is land, with no water.
The biggest company in Heath Springs is Rico Industries. They make many different sports-licensed products. These include items like wallets, flags, and covers for outdoor grills.
Population and People
This section tells us about the people who live in Heath Springs over time. A census is a count of all the people in a place. The numbers below show how the population has changed.
| Historical population | |||
|---|---|---|---|
| Census | Pop. | %± | |
| 1900 | 266 | — | |
| 1910 | 452 | 69.9% | |
| 1920 | 505 | 11.7% | |
| 1930 | 520 | 3.0% | |
| 1940 | 570 | 9.6% | |
| 1950 | 694 | 21.8% | |
| 1960 | 832 | 19.9% | |
| 1970 | 955 | 14.8% | |
| 1980 | 979 | 2.5% | |
| 1990 | 907 | −7.4% | |
| 2000 | 864 | −4.7% | |
| 2010 | 790 | −8.6% | |
| 2020 | 742 | −6.1% | |
| U.S. Decennial Census 2010 2020 | |||
2020 Census Details
The 2020 census also looked at the different groups of people living in Heath Springs. This table shows the racial and ethnic makeup of the town. The US Census counts Hispanic/Latino as an ethnic group, separate from racial categories. People of any race can be Hispanic or Latino.
| Race / Ethnicity (NH = Non-Hispanic) | Pop 2010 | Pop 2020 | % 2010 | % 2020 |
|---|---|---|---|---|
| White alone (NH) | 355 | 369 | 44.94% | 49.73% |
| Black or African American alone (NH) | 418 | 331 | 52.91% | 44.61% |
| Native American or Alaska Native alone (NH) | 1 | 3 | 0.13% | 0.40% |
| Asian alone (NH) | 2 | 1 | 0.25% | 0.13% |
| Pacific Islander alone (NH) | 1 | 0 | 0.13% | 0.00% |
| Other race alone (NH) | 6 | 5 | 0.76% | 0.67% |
| Mixed race or Multiracial (NH) | 6 | 12 | 0.76% | 1.62% |
| Hispanic or Latino (any race) | 1 | 21 | 0.13% | 2.83% |
| Total | 790 | 742 | 100.00% | 100.00% |
See also
 In Spanish: Heath Springs para niños
 | DeHart Hubbard |
 | Wilma Rudolph |
 | Jesse Owens |
 | Jackie Joyner-Kersee |
 | Major Taylor |

