Hiltonia, Georgia facts for kids
Quick facts for kids
Hiltonia, Georgia
|
|
|---|---|

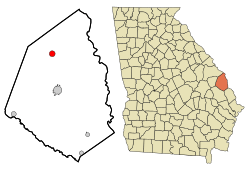
Location in Screven County and the state of Georgia
|
|
| Country | United States |
| State | Georgia |
| County | Screven |
| Area | |
| • Total | 1.74 sq mi (4.51 km2) |
| • Land | 1.72 sq mi (4.46 km2) |
| • Water | 0.02 sq mi (0.05 km2) |
| Elevation | 180 ft (55 m) |
| Population
(2020)
|
|
| • Total | 310 |
| • Density | 180.02/sq mi (69.52/km2) |
| Time zone | UTC-5 (Eastern (EST)) |
| • Summer (DST) | UTC-4 (EDT) |
| ZIP code |
30467
|
| Area code(s) | 912 |
| FIPS code | 13-38920 |
| GNIS feature ID | 0356311 |
Hiltonia is a small city located in Screven County, which is in the state of Georgia, United States. In 2020, about 310 people lived there.
Where is Hiltonia Located?
Hiltonia is a small city. According to the United States Census Bureau, the city covers a total area of about 1.7 square miles (4.4 km2). Most of this area is land, while a very small part (less than 1%) is water.
Who Lives in Hiltonia?
The number of people living in Hiltonia has changed over the years. This information comes from the U.S. Decennial Census, which counts everyone in the United States every ten years. Hiltonia was first counted in the 1920 U.S. Census.
| Historical population | |||
|---|---|---|---|
| Census | Pop. | %± | |
| 1920 | 262 | — | |
| 1930 | 226 | −13.7% | |
| 1940 | 246 | 8.8% | |
| 1950 | 318 | 29.3% | |
| 1960 | 353 | 11.0% | |
| 1970 | 294 | −16.7% | |
| 1980 | 515 | 75.2% | |
| 1990 | 402 | −21.9% | |
| 2000 | 421 | 4.7% | |
| 2010 | 342 | −18.8% | |
| 2020 | 310 | −9.4% | |
| U.S. Decennial Census 1850-1870 1870-1880 1890-1910 1920-1930 1940 1950 1960 1970 1980 1990 2000 2010 2020 |
|||
Different Groups of People
The table below shows the different groups of people who have lived in Hiltonia over time. The census counts people based on their race and whether they are of Hispanic or Latino background.
| Race / Ethnicity (NH = Not Hispanic) | Pop 2000 | Pop 2010 | Pop 2020 | % 2000 | % 2010 | % 2020 |
|---|---|---|---|---|---|---|
| White alone (NH) | 122 | 109 | 114 | 28.98% | 31.87% | 36.77% |
| Black or African American alone (NH) | 294 | 226 | 188 | 69.83% | 66.08% | 60.65% |
| Native American or Alaska Native alone (NH) | 1 | 0 | 1 | 0.24% | 0.00% | 0.32% |
| Asian alone (NH) | 3 | 0 | 0 | 0.71% | 0.00% | 0.00% |
| Pacific Islander alone (NH) | 0 | 0 | 0 | 0.00% | 0.00% | 0.00% |
| Some Other Race alone (NH) | 0 | 0 | 0 | 0.00% | 0.00% | 0.00% |
| Mixed Race or Multi-Racial (NH) | 1 | 4 | 4 | 0.24% | 1.17% | 1.29% |
| Hispanic or Latino (any race) | 0 | 3 | 3 | 0.00% | 0.88% | 0.97% |
| Total | 421 | 342 | 310 | 100.00% | 100.00% | 100.00% |
In 2000, there were 421 people living in Hiltonia, making up 134 households and 101 families. By 2020, the population had changed to 310 people.
See also
 In Spanish: Hiltonia para niños

