Las Palmas II, Texas facts for kids
Quick facts for kids
Las Palmas II
|
|
|---|---|
| Country | United States |
| State | Texas |
| County | Cameron |
| Area | |
| • Total | 0.31 sq mi (0.79 km2) |
| • Land | 0.30 sq mi (0.78 km2) |
| • Water | 0.004 sq mi (0.01 km2) |
| Elevation | 45 ft (14 m) |
| Population
(2020)
|
|
| • Total | 891 |
| • Density | 2,921/sq mi (1,128/km2) |
| Time zone | UTC-6 (Central (CST)) |
| • Summer (DST) | UTC-5 (CDT) |
| FIPS code | 48-41580 |
Las Palmas II is a small community in Cameron County, Texas, in the United States. It's called a census-designated place (CDP). This means it's an area that the government counts for population, but it's not officially a city or town with its own local government. The "II" helps tell it apart from another place called Las Palmas in a different county.
In 2010, about 1,605 people lived here. By 2020, the population was 891. Before 2010, Las Palmas II was part of a larger area called Las Palmas-Juarez. It is also part of the larger Brownsville–Harlingen metropolitan area, which is a big urban region.
Contents
Where is Las Palmas II Located?
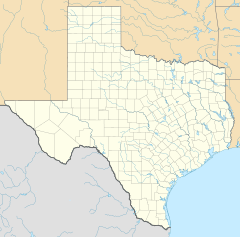
Las Palmas II is found in the western part of Cameron County. It shares its northern border with the city of Harlingen. To its east, you'll find the community of Juarez.
The United States Census Bureau says that Las Palmas II covers a total area of about 0.79 square kilometers (which is about 0.3 square miles). Most of this area, 0.78 square kilometers, is land. A very small part, about 0.01 square kilometers, is water.
Who Lives in Las Palmas II?
The population of Las Palmas II has changed over the years. This community first appeared as its own census-designated place in the 2010 U.S. Census. Before that, it was combined with Juarez to form the Las Palmas-Juarez CDP.
Here's how the population has been counted:
| Historical population | |||
|---|---|---|---|
| Census | Pop. | %± | |
| 2010 | 1,605 | — | |
| 2020 | 891 | −44.5% | |
| U.S. Decennial Census 1850–1900 1910 1920 1930 1940 1950 1960 1970 1980 1990 2000 2010 |
|||
Population Details from 2020
The table below shows the different groups of people who lived in Las Palmas II during the 2010 and 2020 censuses. The census counts people by their race and also by whether they are of Hispanic or Latino origin.
| Race / Ethnicity (NH = Non-Hispanic) | Pop 2010 | Pop 2020 | % 2010 | % 2020 |
|---|---|---|---|---|
| White alone (NH) | 77 | 20 | 4.80% | 2.24% |
| Black or African American alone (NH) | 0 | 0 | 0.00% | 0.00% |
| Native American or Alaska Native alone (NH) | 0 | 2 | 0.00% | 0.22% |
| Asian alone (NH) | 4 | 0 | 0.25% | 0.00% |
| Pacific Islander alone (NH) | 0 | 0 | 0.00% | 0.00% |
| Some Other Race alone (NH) | 0 | 4 | 0.00% | 0.45% |
| Mixed Race or Multi-Racial (NH) | 0 | 3 | 0.00% | 0.34% |
| Hispanic or Latino (any race) | 1,524 | 862 | 94.95% | 96.75% |
| Total | 1,605 | 891 | 100.00% |
See also

- In Spanish: Las Palmas II para niños
 | William M. Jackson |
 | Juan E. Gilbert |
 | Neil deGrasse Tyson |


