LeFlore, Oklahoma facts for kids
Quick facts for kids
LeFlore, Oklahoma
|
|
|---|---|
|
Town
|
|

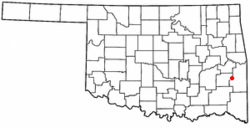
Location of LeFlore, Oklahoma
|
|
| Country | United States |
| State | Oklahoma |
| County | LeFlore |
| Area | |
| • Total | 1.32 sq mi (3.42 km2) |
| • Land | 1.31 sq mi (3.40 km2) |
| • Water | 0.01 sq mi (0.01 km2) |
| Elevation | 545 ft (166 m) |
| Population
(2020)
|
|
| • Total | 150 |
| • Density | 114.16/sq mi (44.07/km2) |
| Time zone | UTC-6 (Central (CST)) |
| • Summer (DST) | UTC-5 (CDT) |
| ZIP code |
74942
|
| Area code(s) | 539/918 |
| FIPS code | 40-42150 |
| GNIS feature ID | 2412884 |
LeFlore is a small town in LeFlore County, Oklahoma, United States. It is part of the Fort Smith, Arkansas-Oklahoma Metropolitan Statistical Area. In 2010, 198 people lived there. This was a 13.1 percent increase from the 168 people counted in 2000. Even though the town's official name is spelled "LeFlore" (two words), the United States government and postal service use "Leflore" (one word).
History of LeFlore
When Was LeFlore Founded?
The community of LeFlore began as a stop for trains on the St. Louis and San Francisco Railroad. This railroad line opened in 1887. A post office was also opened in LeFlore, which was then part of the Indian Territory, on August 26, 1887.
Who Was LeFlore Named After?
The town was named after the LeFlore family. At the time it was founded, LeFlore was located in the Moshulatubbee District of the Choctaw Nation.
Geography of LeFlore
Where is LeFlore Located?
LeFlore is about 25 miles (40 km) west of Poteau.
How Big is LeFlore?
According to the United States Census Bureau, the town covers a total area of 1.4 square miles (3.6 square kilometers). Almost all of this area, 1.4 square miles (3.6 square kilometers), is land. Only a very small part, about 0.71%, is water.
Population and People in LeFlore
How Has LeFlore's Population Changed?
The population of LeFlore has changed over the years:
| Historical population | |||
|---|---|---|---|
| Census | Pop. | %± | |
| 1970 | 175 | — | |
| 1980 | 322 | 84.0% | |
| 1990 | 119 | −63.0% | |
| 2000 | 168 | 41.2% | |
| 2010 | 190 | 13.1% | |
| 2020 | 150 | −21.1% | |
| U.S. Decennial Census | |||
Who Lives in LeFlore?
In the year 2000, there were 168 people living in LeFlore. These people lived in 65 households, and 47 of these were families. The town had about 120.7 people per square mile (46.6 people per square kilometer). There were 79 homes in total.
Many different people live in LeFlore. In 2000, about 67.26% of the people were White. About 27.98% were Native American. A small number, 0.60%, were Asian. About 4.17% of the people were from two or more different backgrounds. Also, 0.60% of the population were Hispanic or Latino.
What Are Households Like in LeFlore?
Out of the 65 households in 2000, about 36.9% had children under 18 living with them. Most households, 56.9%, were married couples living together. About 10.8% had a female head of the household with no husband present. Around 26.2% were not families.
About 23.1% of all households had only one person living there. And 9.2% had someone living alone who was 65 years old or older. On average, there were 2.58 people in each household. For families, the average size was 3.04 people.
How Old Are LeFlore's Residents?
The population in LeFlore is spread out by age. About 26.2% of the people were under 18 years old. Around 10.7% were between 18 and 24. About 23.2% were between 25 and 44. Another 25.0% were between 45 and 64. Finally, 14.9% of the people were 65 years old or older. The average age in the town was 36 years. For every 100 females, there were about 115.4 males. For every 100 females aged 18 and over, there were about 110.2 males.
See also
 In Spanish: Le Flore (Oklahoma) para niños

