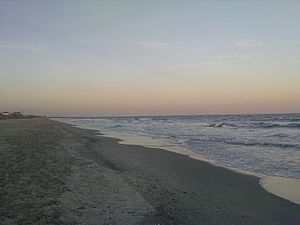
Litchfield Beach, South Carolina facts for kids
Quick facts for kids
Litchfield Beach, South Carolina
|
|
|---|---|
 |
|
| Nickname(s):
Litchfield
|
|
| Country | United States |
| State | South Carolina |
| County | Georgetown |
| Developed | 1960 |
| Area | |
| • Total | 11.69 sq mi (30.29 km2) |
| • Land | 11.23 sq mi (29.07 km2) |
| • Water | 0.47 sq mi (1.21 km2) |
| Population
(2020)
|
|
| • Total | 8,370 |
| • Density | 745.59/sq mi (287.88/km2) |
| Time zone | Eastern |
| • Summer (DST) | Eastern |
| ZIP code |
29585
|
| Area code(s) | 843 |
| FIPS code | 45-41830 |
Litchfield Beach, often called simply Litchfield, is a beautiful coastal community in South Carolina, United States. It's not a city with its own government, but a special area called a census-designated place (CDP). This means the government counts its population for official records. In the 2020 census, about 8,370 people lived there.
Litchfield Beach is located just three miles north of Pawleys Island. It's part of the famous South Carolina Grand Strand, a long stretch of lovely beaches. Within Litchfield Beach, you'll find smaller communities like Litchfield-By-The-Sea and North Litchfield.
The community gets its name from Litchfield Plantation. This was a large rice farm that started way back in the early 1700s. In the 1950s, the area was first known as Retreat Beach. Modern development of Litchfield Beach as we know it today began in the 1960s.
People and Population in Litchfield Beach
Litchfield Beach is home to thousands of people. Understanding the population helps us learn about the community. The United States government counts people every ten years in what's called a census.
How Many People Live Here?
The most recent count of people in Litchfield Beach was done in 2020.
| Historical population | |||
|---|---|---|---|
| Census | Pop. | %± | |
| 2020 | 8,370 | — | |
| U.S. Decennial Census 2020 |
|||
In 2020, the total population of Litchfield Beach was 8,370 people. This number helps us see how the community is growing or changing over time.
Who Lives in Litchfield Beach?
The census also collects information about the different groups of people living in a place. This helps us understand the community's diversity. Here's a look at the different groups in Litchfield Beach from the 2020 census:
| Race / Ethnicity | Pop 2020 | % 2020 |
|---|---|---|
| White alone (NH) | 7,094 | 84.76% |
| Black or African American alone (NH) | 753 | 9.00% |
| Native American or Alaska Native alone (NH) | 17 | 0.20% |
| Asian alone (NH) | 34 | 0.41% |
| Pacific Islander alone (NH) | 10 | 0.12% |
| Some Other Race alone (NH) | 23 | 0.27% |
| Mixed Race/Multi-Racial (NH) | 198 | 2.37% |
| Hispanic or Latino (any race) | 241 | 2.88% |
| Total | 8,370 | 100.00% |
Note: The US Census counts people who are Hispanic or Latino as an ethnic group. This means they are listed separately from the racial categories. People who are Hispanic or Latino can be of any race.
 | Kyle Baker |
 | Joseph Yoakum |
 | Laura Wheeler Waring |
 | Henry Ossawa Tanner |

