Logan, Iowa facts for kids
Quick facts for kids
Logan, Iowa
|
|
|---|---|
 |
|
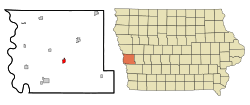
Location of Logan within Harrison County and Iowa
|
|
| Country | United States |
| State | Iowa |
| County | Harrison |
| Incorporated | April 22, 1876 |
| Area | |
| • Total | 1.01 sq mi (2.60 km2) |
| • Land | 1.01 sq mi (2.60 km2) |
| • Water | 0.00 sq mi (0.00 km2) |
| Elevation | 1,102 ft (336 m) |
| Population
(2020)
|
|
| • Total | 1,397 |
| • Density | 1,389.79/sq mi (536.60/km2) |
| Time zone | UTC-6 (CST) |
| • Summer (DST) | UTC-5 (CDT) |
| ZIP codes |
51546, 51550
|
| Area code | 712 |
| FIPS code | 19-46155 |
| GNIS feature ID | 2395744 |
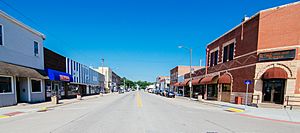
Logan is a city in Iowa, United States. It is the main town, or county seat, of Harrison County, Iowa. Logan is located right next to the Boyer River. In 2020, about 1,397 people lived there.
Contents
History of Logan
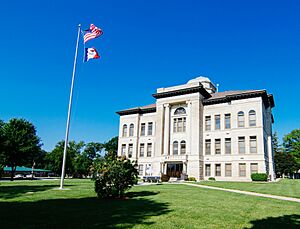
Logan was officially planned out in 1867. This happened when the Chicago and North Western Railway built its tracks to this spot. The city was named after John A. Logan, who was a general in the Union Army during the American Civil War.
Geography and Climate
Logan is a small city, covering about 1.01 square miles (2.6 square kilometers) of land. There is no water area within the city limits.
Weather in Logan
Logan experiences different types of weather throughout the year. Summers are generally warm, and winters can be quite cold. The city gets rain and snow, with more precipitation in the spring and summer months.
| Climate data for Logan, Iowa (1991–2020, extremes 1893–present) | |||||||||||||
|---|---|---|---|---|---|---|---|---|---|---|---|---|---|
| Month | Jan | Feb | Mar | Apr | May | Jun | Jul | Aug | Sep | Oct | Nov | Dec | Year |
| Record high °F (°C) | 69 (21) |
74 (23) |
89 (32) |
99 (37) |
109 (43) |
108 (42) |
117 (47) |
113 (45) |
107 (42) |
96 (36) |
83 (28) |
72 (22) |
117 (47) |
| Mean maximum °F (°C) | 53.4 (11.9) |
59.1 (15.1) |
74.3 (23.5) |
85.0 (29.4) |
90.7 (32.6) |
94.3 (34.6) |
95.1 (35.1) |
93.9 (34.4) |
91.5 (33.1) |
85.7 (29.8) |
70.6 (21.4) |
56.5 (13.6) |
97.2 (36.2) |
| Mean daily maximum °F (°C) | 30.7 (−0.7) |
35.5 (1.9) |
48.9 (9.4) |
61.7 (16.5) |
72.5 (22.5) |
82.4 (28.0) |
85.6 (29.8) |
83.7 (28.7) |
77.5 (25.3) |
64.7 (18.2) |
48.6 (9.2) |
35.3 (1.8) |
60.6 (15.9) |
| Daily mean °F (°C) | 20.3 (−6.5) |
24.5 (−4.2) |
37.4 (3.0) |
49.0 (9.4) |
61.0 (16.1) |
71.3 (21.8) |
74.8 (23.8) |
72.5 (22.5) |
64.4 (18.0) |
51.4 (10.8) |
37.0 (2.8) |
25.3 (−3.7) |
49.1 (9.5) |
| Mean daily minimum °F (°C) | 9.9 (−12.3) |
13.5 (−10.3) |
25.8 (−3.4) |
36.3 (2.4) |
49.4 (9.7) |
60.1 (15.6) |
64.1 (17.8) |
61.2 (16.2) |
51.3 (10.7) |
38.2 (3.4) |
25.4 (−3.7) |
15.3 (−9.3) |
37.5 (3.1) |
| Mean minimum °F (°C) | −13.7 (−25.4) |
−8.2 (−22.3) |
4.6 (−15.2) |
20.8 (−6.2) |
33.9 (1.1) |
46.9 (8.3) |
52.9 (11.6) |
50.6 (10.3) |
35.7 (2.1) |
22.2 (−5.4) |
8.4 (−13.1) |
−6.4 (−21.3) |
−18.0 (−27.8) |
| Record low °F (°C) | −35 (−37) |
−34 (−37) |
−21 (−29) |
4 (−16) |
21 (−6) |
36 (2) |
35 (2) |
37 (3) |
19 (−7) |
−2 (−19) |
−14 (−26) |
−30 (−34) |
−35 (−37) |
| Average precipitation inches (mm) | 0.72 (18) |
0.98 (25) |
1.82 (46) |
3.40 (86) |
4.95 (126) |
5.21 (132) |
4.06 (103) |
4.29 (109) |
3.54 (90) |
2.61 (66) |
1.45 (37) |
1.40 (36) |
34.43 (875) |
| Average snowfall inches (cm) | 7.9 (20) |
6.4 (16) |
4.1 (10) |
0.9 (2.3) |
0.0 (0.0) |
0.0 (0.0) |
0.0 (0.0) |
0.0 (0.0) |
0.0 (0.0) |
0.6 (1.5) |
2.2 (5.6) |
6.6 (17) |
28.7 (73) |
| Average precipitation days (≥ 0.01 in) | 5.0 | 5.6 | 7.2 | 9.7 | 12.5 | 9.9 | 8.6 | 8.9 | 7.6 | 7.1 | 5.2 | 5.6 | 92.9 |
| Average snowy days (≥ 0.1 in) | 3.9 | 3.3 | 1.9 | 0.5 | 0.0 | 0.0 | 0.0 | 0.0 | 0.0 | 0.4 | 1.5 | 3.6 | 15.1 |
| Source: NOAA | |||||||||||||
Population and People
Logan's population has changed over the years. Here's a quick look at how many people have lived there during different census counts:
| Historical populations | ||
|---|---|---|
| Year | Pop. | ±% |
| 1880 | 644 | — |
| 1890 | 827 | +28.4% |
| 1900 | 1,377 | +66.5% |
| 1910 | 1,453 | +5.5% |
| 1920 | 1,637 | +12.7% |
| 1930 | 1,654 | +1.0% |
| 1940 | 1,700 | +2.8% |
| 1950 | 1,550 | −8.8% |
| 1960 | 1,605 | +3.5% |
| 1970 | 1,526 | −4.9% |
| 1980 | 1,540 | +0.9% |
| 1990 | 1,401 | −9.0% |
| 2000 | 1,545 | +10.3% |
| 2010 | 1,534 | −0.7% |
| 2020 | 1,397 | −8.9% |
| Source: and Iowa Data Center Source: |
||
Logan's Population in 2020
In 2020, the census counted 1,397 people living in Logan. There were 573 households, which are groups of people living together in one home.
Most of the people in Logan are White, making up about 96.3% of the population. A small number of people are from other racial backgrounds. About 1.4% of the population identified as Hispanic or Latino.
The average age of people in Logan was about 40.3 years old. About 27.3% of the residents were under 20 years old.
Logan's Population in 2010
Back in 2010, the census showed that 1,534 people lived in Logan. There were 595 households in the city.
Most people were White, making up 98.6% of the population. A small percentage of people were from other racial groups. About 0.8% of the population was Hispanic or Latino.
The average age in 2010 was 38.5 years. About 26.9% of the people were under 18 years old.
Education in Logan
The local public schools in Logan are managed by the Logan–Magnolia Community School District. This district helps make sure students in Logan get a good education.
See also
 In Spanish: Logan (Iowa) para niños
 | James Van Der Zee |
 | Alma Thomas |
 | Ellis Wilson |
 | Margaret Taylor-Burroughs |

