Loma, Montana facts for kids
Quick facts for kids
Loma, Montana
|
|
|---|---|

Loma, Montana
|
|

Location of Loma, Montana
|
|
| Country | United States |
| State | Montana |
| County | Chouteau |
| Area | |
| • Total | 3.44 sq mi (8.92 km2) |
| • Land | 3.44 sq mi (8.92 km2) |
| • Water | 0.00 sq mi (0.00 km2) |
| Elevation | 2,743 ft (836 m) |
| Population
(2020)
|
|
| • Total | 65 |
| • Density | 18.87/sq mi (7.29/km2) |
| Time zone | UTC-7 (Mountain (MST)) |
| • Summer (DST) | UTC-6 (MDT) |
| ZIP code |
59460
|
| Area code(s) | 406 |
| FIPS code | 30-44800 |
| GNIS feature ID | 2408119 |
Loma is a small community in Chouteau County, Montana, in the United States. It's called a "census-designated place" (CDP) because it's a special area defined for counting people, but it's not a full city or town. In 2020, about 65 people lived there.
Contents
Loma's Past: A Look Back
In 1831, a man named James Kipp from the American Fur Company started the very first settlement in this area. The American Fur Company was a business that traded animal furs. However, the Blackfeet people surrounded their fort, and everyone had to leave quickly.
The next year, the American Fur Company built another trading post, called Fort McKenzie, a little further up the river. Later, in the 1860s, some business people tried to build a town called Ophir near where the Marias and Missouri rivers meet. Sadly, on May 25, 1865, ten men in this new town were killed by the Blackfeet.
Where is Loma? Geography and Climate
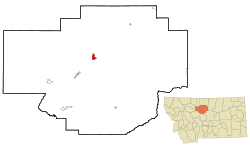
Loma is located in the middle of Chouteau County, right where the Marias River and the Missouri River join together. This meeting point of two rivers is called a confluence.
U.S. Route 87 is a main road that goes through Loma. If you drive southwest for about 10 miles (16 km), you'll reach Fort Benton, which is the main town of Chouteau County. If you drive northeast for about 60 miles (97 km), you'll get to Havre.
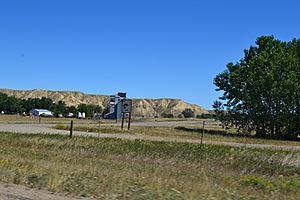
The total area of Loma is about 3.44 square miles (8.92 square kilometers), and it's all land. The weather in Loma is usually dry. Because of this, you'll mostly see short shrubs and grass growing naturally. Trees, especially cottonwood trees, usually grow where people have settled or near riverbanks.
World Record Temperature Change
Loma holds a world record for the most extreme temperature change in just one day! On January 15, 1972, the temperature went from a super cold -54°F (-48°C) all the way up to 49°F (9°C). That's a huge jump of 103 degrees Fahrenheit (57 degrees Celsius)! This amazing change happened because of a special type of warm wind called a Chinook wind.
| Climate data for Loma, Montana, 1991–2020 normals, extremes 1950–present | |||||||||||||
|---|---|---|---|---|---|---|---|---|---|---|---|---|---|
| Month | Jan | Feb | Mar | Apr | May | Jun | Jul | Aug | Sep | Oct | Nov | Dec | Year |
| Record high °F (°C) | 72 (22) |
76 (24) |
84 (29) |
95 (35) |
100 (38) |
107 (42) |
108 (42) |
111 (44) |
104 (40) |
94 (34) |
80 (27) |
71 (22) |
111 (44) |
| Mean maximum °F (°C) | 59.4 (15.2) |
60.9 (16.1) |
70.8 (21.6) |
80.0 (26.7) |
86.6 (30.3) |
93.6 (34.2) |
101.0 (38.3) |
100.4 (38.0) |
94.6 (34.8) |
83.8 (28.8) |
68.9 (20.5) |
59.3 (15.2) |
102.3 (39.1) |
| Mean daily maximum °F (°C) | 34.1 (1.2) |
38.3 (3.5) |
48.7 (9.3) |
59.4 (15.2) |
69.0 (20.6) |
77.2 (25.1) |
87.6 (30.9) |
86.5 (30.3) |
75.6 (24.2) |
60.7 (15.9) |
46.2 (7.9) |
36.3 (2.4) |
60.0 (15.6) |
| Daily mean °F (°C) | 20.6 (−6.3) |
24.3 (−4.3) |
34.1 (1.2) |
44.6 (7.0) |
54.1 (12.3) |
62.4 (16.9) |
70.1 (21.2) |
68.5 (20.3) |
58.4 (14.7) |
45.1 (7.3) |
32.4 (0.2) |
22.9 (−5.1) |
44.8 (7.1) |
| Mean daily minimum °F (°C) | 7.2 (−13.8) |
10.2 (−12.1) |
19.5 (−6.9) |
29.9 (−1.2) |
39.2 (4.0) |
47.6 (8.7) |
52.7 (11.5) |
50.5 (10.3) |
41.2 (5.1) |
29.5 (−1.4) |
18.7 (−7.4) |
9.5 (−12.5) |
29.6 (−1.3) |
| Mean minimum °F (°C) | −23.8 (−31.0) |
−17.0 (−27.2) |
−2.8 (−19.3) |
14.4 (−9.8) |
25.7 (−3.5) |
36.6 (2.6) |
42.1 (5.6) |
38.1 (3.4) |
27.5 (−2.5) |
10.7 (−11.8) |
−5.9 (−21.1) |
−16.0 (−26.7) |
−31.9 (−35.5) |
| Record low °F (°C) | −54 (−48) |
−50 (−46) |
−38 (−39) |
−12 (−24) |
13 (−11) |
28 (−2) |
36 (2) |
30 (−1) |
15 (−9) |
−17 (−27) |
−33 (−36) |
−54 (−48) |
−54 (−48) |
| Average precipitation inches (mm) | 0.53 (13) |
0.37 (9.4) |
0.50 (13) |
1.37 (35) |
2.01 (51) |
2.53 (64) |
1.19 (30) |
1.17 (30) |
1.12 (28) |
0.99 (25) |
0.61 (15) |
0.40 (10) |
12.79 (325) |
| Average snowfall inches (cm) | 8.4 (21) |
5.4 (14) |
5.0 (13) |
1.9 (4.8) |
0.8 (2.0) |
0.0 (0.0) |
0.0 (0.0) |
0.0 (0.0) |
0.0 (0.0) |
1.6 (4.1) |
6.1 (15) |
7.1 (18) |
36.3 (92) |
| Average precipitation days (≥ 0.01 in) | 5.3 | 5.2 | 5.0 | 7.7 | 9.5 | 10.2 | 6.3 | 5.4 | 5.4 | 5.7 | 5.2 | 5.1 | 76.0 |
| Average snowy days (≥ 0.1 in) | 4.3 | 4.2 | 2.5 | 0.8 | 0.3 | 0.0 | 0.0 | 0.0 | 0.0 | 0.7 | 2.7 | 4.1 | 19.6 |
| Source 1: NOAA | |||||||||||||
| Source 2: National Weather Service | |||||||||||||
Who Lives in Loma? Demographics
| Historical population | |||
|---|---|---|---|
| Census | Pop. | %± | |
| 2010 | 85 | — | |
| 2020 | 65 | −23.5% | |
| U.S. Decennial Census | |||
In 2000, there were 92 people living in Loma. These people lived in 40 different homes, and 25 of those were families. The community had 47 housing units in total.
Most of the people living in Loma were White (about 97.83%), and a small number were Native American (about 2.17%).
About 32.5% of the homes had children under 18 living there. About 47.5% of the homes were married couples. The average home had 2.30 people, and the average family had 3.00 people.
The population was spread out in terms of age. About 28.3% of the people were under 18 years old. About 12.0% were 65 years or older. The average age in Loma was 39 years old.
See also
 In Spanish: Loma (Montana) para niños
 | Emma Amos |
 | Edward Mitchell Bannister |
 | Larry D. Alexander |
 | Ernie Barnes |

