McCammon, Idaho facts for kids
Quick facts for kids
McCammon, Idaho
|
|
|---|---|

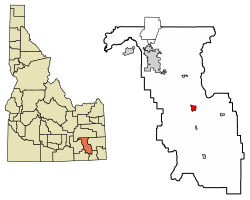
Location of McCammon in Bannock County, Idaho.
|
|
| Country | United States |
| State | Idaho |
| County | Bannock |
| Area | |
| • Total | 2.25 sq mi (5.83 km2) |
| • Land | 2.23 sq mi (5.77 km2) |
| • Water | 0.02 sq mi (0.06 km2) |
| Elevation | 4,771 ft (1,454 m) |
| Population
(2020)
|
|
| • Total | 825 |
| • Density | 372.81/sq mi (143.97/km2) |
| Time zone | UTC-7 (Mountain (MST)) |
| • Summer (DST) | UTC-6 (MDT) |
| ZIP code |
83250
|
| Area code(s) | 208, 986 |
| FIPS code | 16-48880 |
| GNIS feature ID | 2411060 |
McCammon is a small city in Bannock County, Idaho, in the United States. It's part of the larger Pocatello area. In 2020, about 825 people lived there.
McCammon got its start as an important railroad hub in 1892. Because it was where two big railroads met, it was often called Junction City. The Oregon Short Line Railroad and the Utah and Northern Railway both connected here.
Contents
Geography of McCammon
McCammon covers a total area of about 2.28 square miles (5.9 square kilometers). Most of this area is land, about 2.25 square miles (5.83 square kilometers). A very small part, about 0.03 square miles (0.08 square kilometers), is water.
Population and People
| Historical population | |||
|---|---|---|---|
| Census | Pop. | %± | |
| 1910 | 321 | — | |
| 1920 | 467 | 45.5% | |
| 1930 | 497 | 6.4% | |
| 1940 | 489 | −1.6% | |
| 1950 | 578 | 18.2% | |
| 1960 | 557 | −3.6% | |
| 1970 | 623 | 11.8% | |
| 1980 | 770 | 23.6% | |
| 1990 | 722 | −6.2% | |
| 2000 | 805 | 11.5% | |
| 2010 | 809 | 0.5% | |
| 2020 | 825 | 2.0% | |
| 2023 (est.) | 816 | 0.9% | |
| U.S. Decennial Census | |||
How Many People Live Here?
The city's population has grown over the years. In 1910, there were 321 people. By 2020, the population had more than doubled to 825 residents.
McCammon's Population in 2010
In 2010, there were 809 people living in McCammon. These people lived in 287 different homes. About 217 of these were family homes.
The city had about 359.6 people per square mile. Most residents (97.7%) were White. A small number were African American (0.4%) or Native American (0.5%). About 2.3% of the population was Hispanic or Latino.
Many homes (39.7%) had children under 18 living there. Most homes (61.0%) were married couples living together. The average household had about 2.82 people. The average family had about 3.29 people.
The average age in McCammon was 34.8 years old. About 30.7% of residents were under 18. About 13.7% were 65 or older. Slightly more than half (51.3%) of the residents were male.
McCammon's Climate
McCammon has a type of weather called a humid continental climate. This means it has big changes in temperature throughout the year. Summers are usually warm to hot, and sometimes humid. Winters are cold, and can be very cold.
| Climate data for McCammon, Idaho, 1991–2020 normals, extremes 1949–present | |||||||||||||
|---|---|---|---|---|---|---|---|---|---|---|---|---|---|
| Month | Jan | Feb | Mar | Apr | May | Jun | Jul | Aug | Sep | Oct | Nov | Dec | Year |
| Record high °F (°C) | 52 (11) |
63 (17) |
74 (23) |
85 (29) |
94 (34) |
98 (37) |
103 (39) |
101 (38) |
103 (39) |
89 (32) |
72 (22) |
61 (16) |
103 (39) |
| Mean maximum °F (°C) | 43.6 (6.4) |
49.9 (9.9) |
64.6 (18.1) |
75.5 (24.2) |
82.6 (28.1) |
89.9 (32.2) |
95.8 (35.4) |
94.3 (34.6) |
88.3 (31.3) |
76.8 (24.9) |
61.8 (16.6) |
48.3 (9.1) |
96.3 (35.7) |
| Mean daily maximum °F (°C) | 32.2 (0.1) |
37.1 (2.8) |
48.8 (9.3) |
58.3 (14.6) |
68.0 (20.0) |
77.0 (25.0) |
87.3 (30.7) |
85.6 (29.8) |
75.9 (24.4) |
61.4 (16.3) |
45.6 (7.6) |
33.5 (0.8) |
59.2 (15.1) |
| Daily mean °F (°C) | 23.7 (−4.6) |
27.7 (−2.4) |
37.4 (3.0) |
45.3 (7.4) |
53.7 (12.1) |
61.5 (16.4) |
69.6 (20.9) |
68.1 (20.1) |
59.1 (15.1) |
46.8 (8.2) |
34.8 (1.6) |
25.3 (−3.7) |
46.1 (7.8) |
| Mean daily minimum °F (°C) | 14.6 (−9.7) |
18.3 (−7.6) |
26.1 (−3.3) |
32.3 (0.2) |
39.4 (4.1) |
46.0 (7.8) |
52.0 (11.1) |
50.7 (10.4) |
42.2 (5.7) |
32.3 (0.2) |
24.0 (−4.4) |
17.1 (−8.3) |
32.9 (0.5) |
| Mean minimum °F (°C) | −4.4 (−20.2) |
−0.8 (−18.2) |
10.7 (−11.8) |
19.4 (−7.0) |
26.7 (−2.9) |
33.0 (0.6) |
41.7 (5.4) |
38.3 (3.5) |
29.2 (−1.6) |
17.1 (−8.3) |
5.4 (−14.8) |
−3.7 (−19.8) |
−9.3 (−22.9) |
| Record low °F (°C) | −28 (−33) |
−26 (−32) |
−8 (−22) |
12 (−11) |
21 (−6) |
26 (−3) |
34 (1) |
30 (−1) |
22 (−6) |
−2 (−19) |
−17 (−27) |
−31 (−35) |
−31 (−35) |
| Average precipitation inches (mm) | 1.80 (46) |
1.32 (34) |
1.24 (31) |
1.19 (30) |
2.01 (51) |
1.17 (30) |
0.60 (15) |
1.04 (26) |
1.24 (31) |
1.15 (29) |
0.97 (25) |
1.73 (44) |
15.46 (392) |
| Average snowfall inches (cm) | 16.8 (43) |
7.0 (18) |
3.5 (8.9) |
1.6 (4.1) |
0.1 (0.25) |
0.0 (0.0) |
0.0 (0.0) |
0.0 (0.0) |
0.0 (0.0) |
0.6 (1.5) |
2.2 (5.6) |
12.9 (33) |
44.7 (114.35) |
| Average extreme snow depth inches (cm) | 12.2 (31) |
10.7 (27) |
5.9 (15) |
0.6 (1.5) |
0.0 (0.0) |
0.0 (0.0) |
0.0 (0.0) |
0.0 (0.0) |
0.0 (0.0) |
0.3 (0.76) |
1.8 (4.6) |
7.7 (20) |
16.0 (41) |
| Average precipitation days (≥ 0.01 in) | 11.1 | 9.2 | 8.5 | 8.8 | 9.2 | 6.5 | 4.2 | 4.7 | 4.8 | 6.8 | 7.7 | 12.0 | 93.5 |
| Average snowy days (≥ 0.1 in) | 7.8 | 4.7 | 2.0 | 0.9 | 0.2 | 0.0 | 0.0 | 0.0 | 0.0 | 0.3 | 2.5 | 6.1 | 24.5 |
| Source 1: NOAA | |||||||||||||
| Source 2: National Weather Service | |||||||||||||
See also
 In Spanish: McCammon para niños
 | Emma Amos |
 | Edward Mitchell Bannister |
 | Larry D. Alexander |
 | Ernie Barnes |

