Moro, Oregon facts for kids
Quick facts for kids
Moro, Oregon
|
|
|---|---|

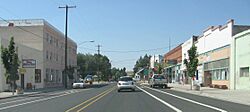
Moro, viewed looking down U.S. Highway 97, the town's main street
|
|

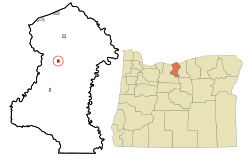
Location in Oregon
|
|
| Country | United States |
| State | Oregon |
| County | Sherman |
| Incorporated | 1899 |
| Area | |
| • Total | 0.50 sq mi (1.28 km2) |
| • Land | 0.50 sq mi (1.28 km2) |
| • Water | 0.00 sq mi (0.00 km2) |
| Elevation | 1,850 ft (560 m) |
| Population
(2020)
|
|
| • Total | 367 |
| • Density | 739.92/sq mi (285.69/km2) |
| Time zone | UTC−8 (Pacific) |
| • Summer (DST) | UTC−7 (Pacific) |
| ZIP code |
97039
|
| Area code(s) | 541 |
| FIPS code | 41-50000 |
| GNIS feature ID | 2411166 |
| Website | www.cityofmoro.net |
Moro is a small city located in Sherman County, Oregon, in the United States. In 2020, about 367 people lived there. It is the main town, or county seat, of Sherman County. Moro is currently the smallest county seat in Oregon by population. The city was officially made a town on February 17, 1899. It was named after a place called Moro, Illinois.
Contents
Geography and Weather in Moro
Moro is a city that covers about 0.49 square miles (1.28 square kilometers) of land. There is no water area within the city limits.
Moro's Climate: Hot Summers, Cool Winters
Moro has a type of weather called a Mediterranean climate. This means it has hot, dry summers and cool, wet winters. During summer, afternoons are very warm and sunny. There is very little rain in July and August. Sometimes, there's no rain at all for many days in a row. Temperatures can reach 90°F (32°C) about twenty days a year. It might even get to 100°F (38°C) twice a year. The hottest temperature ever recorded was 111°F (44°C) on July 27, 1939.
Winter in Moro is cold but usually not extremely harsh. Temperatures stay above freezing most afternoons. Only about two mornings each winter will see temperatures drop to 0°F (-18°C) or lower. The coldest temperature ever recorded was -22°F (-30°C) in January 1957.
Rain and Snow in Moro
Moro gets very little rain because it is in the "rain shadow" of the Cascades mountains. This means the mountains block most of the rain clouds. On average, Moro gets about 11 inches (280 mm) of rain each year. The most rain ever recorded in one month was 6.11 inches (155 mm) in December 1964.
Snowfall in Moro averages about 17 inches (43 cm) per year. However, the amount of snow can change a lot from year to year. For example, in January 1950, over 54 inches (137 cm) of snow fell! But in some years, there is very little snow at all.
| Climate data for Moro, Oregon (1991–2020 normals, extremes 1898, 1917–present) | |||||||||||||
|---|---|---|---|---|---|---|---|---|---|---|---|---|---|
| Month | Jan | Feb | Mar | Apr | May | Jun | Jul | Aug | Sep | Oct | Nov | Dec | Year |
| Record high °F (°C) | 68 (20) |
68 (20) |
75 (24) |
89 (32) |
100 (38) |
113 (45) |
111 (44) |
110 (43) |
100 (38) |
88 (31) |
72 (22) |
65 (18) |
113 (45) |
| Mean daily maximum °F (°C) | 40.1 (4.5) |
44.9 (7.2) |
52.3 (11.3) |
58.8 (14.9) |
67.4 (19.7) |
74.3 (23.5) |
84.0 (28.9) |
83.8 (28.8) |
75.8 (24.3) |
62.2 (16.8) |
48.4 (9.1) |
39.5 (4.2) |
61.0 (16.1) |
| Daily mean °F (°C) | 32.3 (0.2) |
35.5 (1.9) |
41.2 (5.1) |
46.7 (8.2) |
54.5 (12.5) |
60.7 (15.9) |
68.5 (20.3) |
68.2 (20.1) |
60.6 (15.9) |
49.2 (9.6) |
38.5 (3.6) |
31.8 (−0.1) |
49.0 (9.4) |
| Mean daily minimum °F (°C) | 24.5 (−4.2) |
26.2 (−3.2) |
30.1 (−1.1) |
34.5 (1.4) |
41.6 (5.3) |
47.0 (8.3) |
53.0 (11.7) |
52.6 (11.4) |
45.4 (7.4) |
36.2 (2.3) |
28.7 (−1.8) |
24.2 (−4.3) |
37.0 (2.8) |
| Record low °F (°C) | −22 (−30) |
−15 (−26) |
1 (−17) |
18 (−8) |
18 (−8) |
27 (−3) |
34 (1) |
31 (−1) |
21 (−6) |
7 (−14) |
−9 (−23) |
−20 (−29) |
−22 (−30) |
| Average precipitation inches (mm) | 1.47 (37) |
1.06 (27) |
0.97 (25) |
0.96 (24) |
0.96 (24) |
0.57 (14) |
0.18 (4.6) |
0.20 (5.1) |
0.43 (11) |
1.06 (27) |
1.54 (39) |
1.61 (41) |
11.01 (280) |
| Average snowfall inches (cm) | 5.3 (13) |
2.5 (6.4) |
0.7 (1.8) |
0.0 (0.0) |
0.0 (0.0) |
0.0 (0.0) |
0.0 (0.0) |
0.0 (0.0) |
0.0 (0.0) |
0.2 (0.51) |
2.2 (5.6) |
5.7 (14) |
16.6 (42) |
| Average precipitation days (≥ 0.01 in) | 11.1 | 8.9 | 9.5 | 9.2 | 7.5 | 4.8 | 1.8 | 1.7 | 2.9 | 8.3 | 11.6 | 12.2 | 89.5 |
| Average snowy days (≥ 0.1 in) | 3.8 | 1.7 | 0.6 | 0.0 | 0.0 | 0.0 | 0.0 | 0.0 | 0.0 | 0.0 | 1.0 | 3.5 | 10.6 |
| Source: NOAA | |||||||||||||
Population of Moro
The population of Moro has changed over the years. Here's a quick look at how many people have lived in the city during different census years:
| Historical population | |||
|---|---|---|---|
| Census | Pop. | %± | |
| 1900 | 335 | — | |
| 1910 | 378 | 12.8% | |
| 1920 | 418 | 10.6% | |
| 1930 | 352 | −15.8% | |
| 1940 | 309 | −12.2% | |
| 1950 | 359 | 16.2% | |
| 1960 | 327 | −8.9% | |
| 1970 | 290 | −11.3% | |
| 1980 | 336 | 15.9% | |
| 1990 | 292 | −13.1% | |
| 2000 | 337 | 15.4% | |
| 2010 | 324 | −3.9% | |
| 2020 | 367 | 13.3% | |
| U.S. Decennial Census | |||
Moro's Population in 2010
According to the 2010 census, there were 324 people living in Moro. These people lived in 149 households, and 86 of those were families. The city had about 661 people per square mile (255 people per square kilometer).
Most of the people in Moro were White (92.6%). There were also Native American people (3.1%) and people from other races (2.8%). About 4.0% of the population identified as Hispanic or Latino.
The average age of people in Moro was 48.1 years old. About 19.4% of the residents were under 18 years old. About 25.6% were 65 years old or older. The population was almost evenly split between males (47.2%) and females (52.8%).
See also
 In Spanish: Moro (Oregón) para niños
 | James Van Der Zee |
 | Alma Thomas |
 | Ellis Wilson |
 | Margaret Taylor-Burroughs |

