Morrice, Michigan facts for kids
Quick facts for kids
Morrice, Michigan
|
|
|---|---|
|
Village
|
|
| Village of Morrice | |
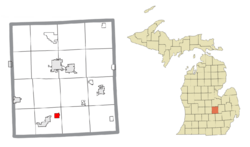
Location within Shiawassee County
|
|
| Country | United States |
| State | Michigan |
| County | Shiawassee |
| Township | Perry |
| Settled | 1837 |
| Incorporated | 1884 |
| Government | |
| • Type | Village council |
| Area | |
| • Total | 1.39 sq mi (3.59 km2) |
| • Land | 1.30 sq mi (3.37 km2) |
| • Water | 0.08 sq mi (0.22 km2) |
| Elevation | 896 ft (273 m) |
| Population
(2020)
|
|
| • Total | 949 |
| • Density | 728.32/sq mi (281.23/km2) |
| Time zone | UTC-5 (Eastern (EST)) |
| • Summer (DST) | UTC-4 (EDT) |
| ZIP code(s) |
48857
|
| Area code(s) | 517 |
| FIPS code | 26-55560 |
| GNIS feature ID | 2399396 |
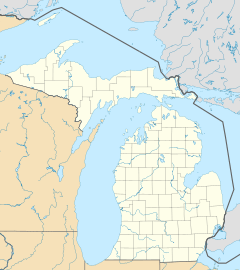
Morrice is a small village located in Shiawassee County, in the state of Michigan, United States. In 2010, about 927 people lived here. By 2020, the population had grown slightly to 949. The village is part of Perry Township. Morrice is also close to the geographic center of Michigan.
Contents
History of Morrice Village
The village of Morrice is named after a man named William Morrice. He was a pioneer, which means he was one of the first people to settle in this area. William Morrice came from Aberdeenshire, Scotland, and moved to this part of Michigan in 1837. The village grew around where he settled.
Understanding Morrice's Geography
Morrice covers a total area of about 1.38 square miles (3.59 square kilometers). Most of this area is land, which is about 1.30 square miles (3.37 square kilometers). A smaller part, about 0.08 square miles (0.22 square kilometers), is made up of water. This means Morrice has some small lakes or rivers within its borders.
Population Changes Over Time
| Historical population | |||
|---|---|---|---|
| Census | Pop. | %± | |
| 1880 | 229 | — | |
| 1890 | 422 | 84.3% | |
| 1900 | 476 | 12.8% | |
| 1910 | 470 | −1.3% | |
| 1920 | 372 | −20.9% | |
| 1930 | 370 | −0.5% | |
| 1940 | 462 | 24.9% | |
| 1950 | 501 | 8.4% | |
| 1960 | 530 | 5.8% | |
| 1970 | 734 | 38.5% | |
| 1980 | 733 | −0.1% | |
| 1990 | 630 | −14.1% | |
| 2000 | 882 | 40.0% | |
| 2010 | 927 | 5.1% | |
| 2020 | 949 | 2.4% | |
| U.S. Decennial Census | |||
Morrice Population in 2010
In 2010, a count of the people living in Morrice showed there were 927 residents. These people lived in 367 households, and 239 of these were families. The village had about 713 people living in each square mile of land.
Most of the people in Morrice were White (97.0%). A small number were African American, Native American, or Asian. Some people identified with two or more races. About 1.6% of the population was Hispanic or Latino.
Many households (37.6%) had children under 18 living with them. About 46.3% of households were married couples. Some households (30.0%) had only one person living there. The average age of people in Morrice was 32.6 years old. About 28.7% of residents were under 18, and 12.4% were 65 or older. The village had slightly more males (50.8%) than females (49.2%).
See also
 In Spanish: Morrice (Míchigan) para niños
 | Shirley Ann Jackson |
 | Garett Morgan |
 | J. Ernest Wilkins Jr. |
 | Elijah McCoy |


