Neeses, South Carolina facts for kids
Quick facts for kids
Neeses, South Carolina
|
|
|---|---|
 |
|

Location of Neeses, South Carolina
|
|
| Country | United States |
| State | South Carolina |
| County | Orangeburg |
| Area | |
| • Total | 1.71 sq mi (4.42 km2) |
| • Land | 1.71 sq mi (4.42 km2) |
| • Water | 0.00 sq mi (0.00 km2) |
| Elevation | 341 ft (104 m) |
| Population
(2020)
|
|
| • Total | 320 |
| • Density | 187.46/sq mi (72.38/km2) |
| Time zone | UTC-5 (Eastern (EST)) |
| • Summer (DST) | UTC-4 (EDT) |
| ZIP code |
29107
|
| Area code(s) | 803, 839 |
| FIPS code | 45-49390 |
| GNIS feature ID | 1231583 |
Neeses is a small town located in Orangeburg County, South Carolina, in the United States. In 2020, the town had a population of 320 people.
Contents
Where is Neeses?
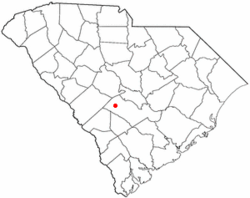
Neeses is found in the state of South Carolina. Its exact location is at coordinates 33.535160 degrees north and 81.125372 degrees west.
The United States Census Bureau says that Neeses covers an area of about 1.7 square miles (4.4 square kilometers). All of this area is land, meaning there are no large lakes or rivers within the town limits.
How Many People Live in Neeses?
The number of people living in Neeses has changed over many years. Here's a quick look at the population from different census years:
| Historical population | |||
|---|---|---|---|
| Census | Pop. | %± | |
| 1910 | 143 | — | |
| 1920 | 289 | 102.1% | |
| 1930 | 320 | 10.7% | |
| 1940 | 364 | 13.8% | |
| 1950 | 328 | −9.9% | |
| 1960 | 347 | 5.8% | |
| 1970 | 388 | 11.8% | |
| 1980 | 557 | 43.6% | |
| 1990 | 410 | −26.4% | |
| 2000 | 413 | 0.7% | |
| 2010 | 374 | −9.4% | |
| 2020 | 320 | −14.4% | |
| U.S. Decennial Census | |||
Who Lives in Neeses?
Based on the 2000 census, there were 413 people living in Neeses. These people made up 175 households and 110 families.
The town's population was a mix of different groups:
- About 74% of the people were White.
- Around 21% were African American.
- A smaller number were Native American or Asian.
- Some people identified as being from two or more races.
- About 1.7% of the population was Hispanic or Latino.
Age and Households
In 2000, the population of Neeses was spread out by age:
- About 26.6% of residents were under 18 years old.
- Around 16% were 65 years old or older.
- The average age of people in Neeses was 36 years old.
Many different types of households lived in Neeses:
- About 30.9% of households had children under 18 living with them.
- 41.7% were married couples living together.
- Some households had a female head without a husband present.
- About 32.6% of all households were made up of people living alone.
See also
 In Spanish: Neeses para niños
 | Kyle Baker |
 | Joseph Yoakum |
 | Laura Wheeler Waring |
 | Henry Ossawa Tanner |

