
New York's 9th congressional district facts for kids
Quick facts for kids New York's 9th congressional district |
|||
|---|---|---|---|
New York's 9th congressional district since January 3, 2013
|
|||
| Representative |
|
||
| Distribution |
|
||
| Population (2019) | 720,316 | ||
| Median income | $69,754 | ||
| Ethnicity |
|
||
| Cook PVI | D+34 | ||
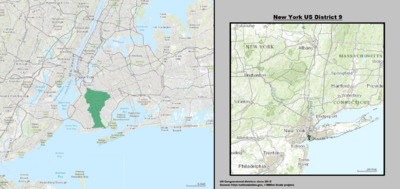
New York's 9th congressional district is a special area in New York City that elects one person to represent its people in the United States House of Representatives. Think of it like a team, and the representative is the team captain who speaks for everyone in that area. This district is entirely within Brooklyn.
The person who represents this district right now is Yvette Clarke. She is a member of the Democratic Party.
The 9th district covers many neighborhoods in Brooklyn. These include Brownsville, Crown Heights, East Flatbush, Flatbush, Kensington, Park Slope, Prospect Heights, Midwood, Sheepshead Bay, Marine Park, Gerritsen Beach, and Prospect Lefferts Gardens.
Contents
About Congressional Districts
A congressional district is a part of a state that has a certain number of people. Each district gets to choose one person to send to the United States House of Representatives in Washington, D.C. These representatives work together to make laws for the whole country.
The number of districts a state has depends on its population. States with more people have more districts and more representatives. New York has many districts because it is a very populated state.
Who Represents the 9th District?
The current representative for New York's 9th congressional district is Yvette Clarke. She was first elected to the House of Representatives in 2007. She works to make sure the voices of the people in her district are heard in the government.
Voting in the 9th District
People in the 9th congressional district vote for their representative every two years. They also vote for president every four years. The district has often voted for Democratic candidates in presidential elections.
For example, in recent presidential elections, the district voted for:
- Bill Clinton in 1992 and 1996
- Al Gore in 2000
- John Kerry in 2004
- Barack Obama in 2008 and 2012
- Hillary Clinton in 2016
This shows that the people in the 9th district often support the Democratic Party.
Images for kids
-
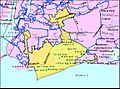
The Ninth District from 1993 to 2003
-
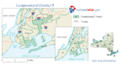
2003 – 2013


See also
 In Spanish: 9.º distrito congresional de Nueva York para niños
