
Newtonsville, Ohio facts for kids
Quick facts for kids
Newtonsville, Ohio
|
|
|---|---|
|
Statutory village
|
|

Businesses along Cross Street
|
|

Location of Newtonsville, Ohio
|
|

Location of Newtonsville in Clermont County
|
|
| Country | United States |
| State | Ohio |
| County | Clermont |
| Township | Wayne |
| Platted | March 30, 1838 |
| Dissolved | November 25, 2019 |
| Area | |
| • Total | 0.19 sq mi (0.49 km2) |
| • Land | 0.19 sq mi (0.49 km2) |
| • Water | 0.00 sq mi (0.00 km2) |
| Elevation | 899 ft (274 m) |
| Population
(2010)
|
|
| • Total | 392 |
| • Estimate
(2019)
|
376 |
| • Density | 1,978.95/sq mi (764.33/km2) |
| Demonym(s) | Newtonsvillager |
| Time zone | UTC-5 (Eastern (EST)) |
| • Summer (DST) | UTC-4 (EDT) |
| ZIP code |
45158
|
| Area code(s) | 513 |
| FIPS code | 39-55664 |
| GNIS feature ID | 2806431 |
Newtonsville is a small community in Clermont County, Ohio, United States. It used to be a village, but its residents voted to dissolve it in 2019. Now, it is an unincorporated community within Wayne Township. In 2010, about 392 people lived there.
Contents
History of Newtonsville
Newtonsville was first planned out on March 30, 1838. Stephen Whitaker and Cornelius Washburn created the layout for the village. A post office opened in Newtonsville in 1847. In the 1800s, the village had a gristmill (a mill for grinding grain) and a factory that made chairs. However, after World War I, many businesses in the village started to close.
Why Newtonsville Dissolved
In 2016, the Ohio State Auditor (a government official who checks how money is spent) noticed that Newtonsville was not keeping good financial records. The village was put on "fiscal caution." This means they were warned about their money problems.
Even though Newtonsville had a one-percent income tax, it still had a large debt of $112,000 by 2019. Because of this, the auditor declared a "fiscal emergency." This meant the village was in serious financial trouble.
On November 5, 2019, the people living in Newtonsville voted on a plan to dissolve the village. This meant it would no longer be its own village and would become part of Wayne Township again. The vote passed, with 53 people voting to dissolve and 46 voting against it. The dissolution officially happened on November 25, 2019. The Ohio State Auditor is helping with the process of changing Newtonsville back into a part of the township.
Geography of Newtonsville
Newtonsville is a small area of land. According to the United States Census Bureau, the community covers about 0.49 square kilometers (0.19 square miles). All of this area is land, with no water.
Population and People
| Historical population | |||
|---|---|---|---|
| Census | Pop. | %± | |
| 1880 | 160 | — | |
| 1910 | 142 | — | |
| 1920 | 120 | −15.5% | |
| 1930 | 148 | 23.3% | |
| 1940 | 166 | 12.2% | |
| 1950 | 182 | 9.6% | |
| 1960 | 339 | 86.3% | |
| 1970 | 385 | 13.6% | |
| 1980 | 434 | 12.7% | |
| 1990 | 427 | −1.6% | |
| 2000 | 492 | 15.2% | |
| 2010 | 392 | −20.3% | |
| 2019 (est.) | 376 | −4.1% | |
| U.S. Decennial Census | |||
Population in 2010
In 2010, a census (a count of the population) showed that 392 people lived in Newtonsville. These people lived in 132 households, and 103 of these were families. The population density was about 764 people per square kilometer (1,979 people per square mile). There were 144 housing units in total.
Most of the people in Newtonsville were White (99.0%). A small number were Native American (0.3%) or from two or more races (0.8%). About 1.0% of the population was Hispanic or Latino.
Households and Families
Out of the 132 households, almost half (49.2%) had children under 18 living with them. More than half (57.6%) were married couples living together. Some households had a female head with no husband (12.1%), or a male head with no wife (8.3%). About 22.0% of households were not families.
About 18.2% of all households had only one person living there. Only 6% had someone living alone who was 65 years old or older. On average, each household had about 2.97 people, and each family had about 3.37 people.
Age Groups
The average age of people in Newtonsville was 32.6 years old.
- About 30.9% of residents were under 18 years old.
- About 8.4% were between 18 and 24 years old.
- About 26.8% were between 25 and 44 years old.
- About 23.5% were between 45 and 64 years old.
- About 10.5% were 65 years old or older.
The population was almost evenly split between males and females. About 48.0% were male and 52.0% were female.
Gallery
-
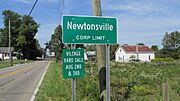
Newtonsville corporation limit sign.
-
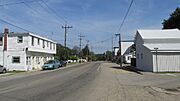
Looking north towards the intersection of West Main Street, Cross and Wright Streets in Newtonsville.


See also
 In Spanish: Newtonsville (Ohio) para niños
