Oneida Castle, New York facts for kids
Quick facts for kids
Oneida Castle, New York
tkanaˀalóhaleˀ
|
|
|---|---|
|
Village
|
|

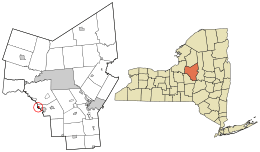
Location in Oneida County and the state of New York.
|
|
| Country | United States |
| State | New York |
| County | Oneida |
| Area | |
| • Total | 0.51 sq mi (1.31 km2) |
| • Land | 0.51 sq mi (1.31 km2) |
| • Water | 0.00 sq mi (0.00 km2) |
| Elevation | 449 ft (137 m) |
| Population
(2020)
|
|
| • Total | 586 |
| • Density | 1,158.10/sq mi (447.16/km2) |
| Time zone | UTC-5 (Eastern (EST)) |
| • Summer (DST) | UTC-4 (EDT) |
| FIPS code | 36-54848 |
| GNIS feature ID | 0959364 |
Oneida Castle (which is called tkanaˀalóhaleˀ in the Oneida language) is a small village in Oneida County, New York, in the United States. In 2020, about 586 people lived there. This village is located in the northwest part of the town of Vernon. Oneida Castle is found east of the city of Oneida and west of the city of Sherrill in New York State.
Contents
History of Oneida Castle
This village was once the site of a very important fortified village. It was called Kanonwalohale (or "tkanaˀalóhaleˀ" in modern Oneida writing). This was a major village for the Oneida tribe. The Oneida are one of the original Five Nations of the Iroquois Confederacy.
Early Settlement and Protection
The Oneida people built this village in the early 1700s. They moved here to escape attacks from the French colony of Quebec. The French were trying to control the fur trade in the area. To protect themselves, the village was surrounded by tall wooden fences called palisades. It also had a ditch, or moat, around it. All the homes and storage buildings were safe inside these defenses.
Village Destruction and New Name
Sadly, in July 1780, a war party led by the Mohawk leader Joseph Brant attacked and destroyed the village. Later, European-American settlers came to the area. They named their new village "Oneida Castle" to remember the last great village of the Oneida people. In the past, Europeans often called large, fortified Iroquois villages "castles." This was because it was a familiar word for them to describe such a strong settlement. Other examples include Seneca Castle and Genesee Castle.
Geography of Oneida Castle
Oneida Castle is located at these coordinates: 43.078335 degrees North and -75.633383 degrees West. It is thought to be near the geographic center of New York State. There have even been ideas in the past to move the state's capital city here!
Area and Land
According to the United States Census Bureau, the village covers a total area of about 0.5 square miles (1.3 square kilometers). All of this area is land, meaning there are no large bodies of water within the village limits.
Population of Oneida Castle
The population of Oneida Castle has changed over many years. Here is a look at how many people have lived in the village during different census years:
| Historical population | |||
|---|---|---|---|
| Census | Pop. | %± | |
| 1870 | 262 | — | |
| 1880 | 239 | −8.8% | |
| 1890 | 317 | 32.6% | |
| 1900 | 291 | −8.2% | |
| 1910 | 393 | 35.1% | |
| 1920 | 466 | 18.6% | |
| 1930 | 490 | 5.2% | |
| 1940 | 556 | 13.5% | |
| 1950 | 596 | 7.2% | |
| 1960 | 754 | 26.5% | |
| 1970 | 788 | 4.5% | |
| 1980 | 751 | −4.7% | |
| 1990 | 671 | −10.7% | |
| 2000 | 627 | −6.6% | |
| 2010 | 625 | −0.3% | |
| 2020 | 586 | −6.2% | |
| U.S. decennial census | |||
Population in 2000
In the year 2000, there were 627 people living in Oneida Castle. These people lived in 264 households, and 178 of these were families. The village had about 1,201 people per square mile. Most of the people living in the village (about 98.25%) were white. A small number were Native Americans (0.80%) or Asian people (0.32%). Some people (0.64%) identified as being from two or more races.
Households and Families
About 26.9% of the households in 2000 had children under 18 living with them. More than half (56.8%) were married couples living together. About 26.1% of households were made up of just one person. The average household had 2.38 people, and the average family had 2.87 people.
Age Groups
The people in Oneida Castle in 2000 were of different ages. About 21.5% were under 18 years old. About 26.5% were between 25 and 44 years old, and 26.8% were between 45 and 64 years old. About 17.5% of the population was 65 years old or older. The average age in the village was 41 years.
See also
 In Spanish: Oneida Castle para niños
 | Selma Burke |
 | Pauline Powell Burns |
 | Frederick J. Brown |
 | Robert Blackburn |

