Orovada, Nevada facts for kids
Quick facts for kids
Orovada, Nevada
|
|
|---|---|
 |
|
| Country | United States |
| State | Nevada |
| County | Humboldt |
| Area | |
| • Total | 22.18 sq mi (57.44 km2) |
| • Land | 22.18 sq mi (57.44 km2) |
| • Water | 0.00 sq mi (0.00 km2) |
| Elevation | 4,236 ft (1,291 m) |
| Population
(2020)
|
|
| • Total | 117 |
| • Density | 5.28/sq mi (2.04/km2) |
| Time zone | UTC-8 (Pacific (PST)) |
| • Summer (DST) | UTC-7 (PDT) |
| ZIP codes |
89425
|
| FIPS code | 32-53000 |
| GNIS feature ID | 2583947 |
Orovada is a small community in Humboldt County, Nevada. It is called a census-designated place (CDP). This means it's a special area the government uses for counting people. In 2020, about 117 people lived there.
Contents
A Look at Orovada's Past
The first people to settle permanently in Orovada arrived in 1918. The name "Orovada" is a mix of two words. "Oro" is a Spanish word that means "gold." The second part comes from "Nevada," the state where it is located. A post office has been open in Orovada since 1920.
Where is Orovada?
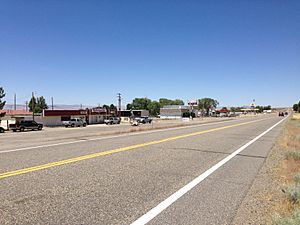
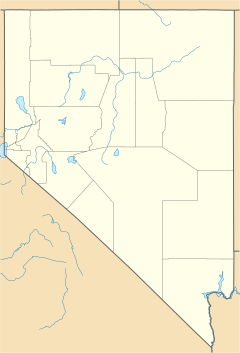
Orovada is located in Nevada, a state in the western United States. The area of Orovada is about 57.44 square kilometers (22.18 square miles). All of this land is dry, with no large bodies of water. U.S. Route 95, a major highway, goes right through Orovada. If you drive south on this road, you'll reach Winnemucca in about 43 miles. If you head north, you'll get to the Oregon state line and McDermitt in about 30 miles.
Orovada's Weather
Orovada has a type of weather called a cold semi-arid climate. This means it's generally dry, but not a true desert. It can get very hot in the summer and very cold in the winter. The highest temperature ever recorded in Orovada was 115°F (46°C) on September 1 and 2, 1947. The coldest temperature ever recorded was -35°F (-37°C) on December 19 and 26, 1924.
| Climate data for Orovada, Nevada, 1991–2020 normals, extremes 1911–present | |||||||||||||
|---|---|---|---|---|---|---|---|---|---|---|---|---|---|
| Month | Jan | Feb | Mar | Apr | May | Jun | Jul | Aug | Sep | Oct | Nov | Dec | Year |
| Record high °F (°C) | 67 (19) |
71 (22) |
81 (27) |
92 (33) |
105 (41) |
107 (42) |
109 (43) |
108 (42) |
115 (46) |
94 (34) |
80 (27) |
68 (20) |
115 (46) |
| Mean maximum °F (°C) | 54.0 (12.2) |
61.1 (16.2) |
71.2 (21.8) |
79.7 (26.5) |
89.2 (31.8) |
96.8 (36.0) |
102.3 (39.1) |
101.0 (38.3) |
94.8 (34.9) |
82.4 (28.0) |
68.3 (20.2) |
56.0 (13.3) |
103.3 (39.6) |
| Mean daily maximum °F (°C) | 42.2 (5.7) |
48.0 (8.9) |
56.2 (13.4) |
62.7 (17.1) |
72.4 (22.4) |
82.9 (28.3) |
93.6 (34.2) |
91.5 (33.1) |
82.0 (27.8) |
67.7 (19.8) |
52.5 (11.4) |
41.4 (5.2) |
66.1 (18.9) |
| Daily mean °F (°C) | 30.7 (−0.7) |
35.5 (1.9) |
41.5 (5.3) |
46.7 (8.2) |
55.4 (13.0) |
63.5 (17.5) |
71.9 (22.2) |
69.6 (20.9) |
60.7 (15.9) |
48.5 (9.2) |
37.9 (3.3) |
29.7 (−1.3) |
49.3 (9.6) |
| Mean daily minimum °F (°C) | 19.1 (−7.2) |
23.0 (−5.0) |
26.8 (−2.9) |
30.8 (−0.7) |
38.3 (3.5) |
44.0 (6.7) |
50.3 (10.2) |
47.7 (8.7) |
39.4 (4.1) |
29.4 (−1.4) |
23.3 (−4.8) |
18.1 (−7.7) |
32.5 (0.3) |
| Mean minimum °F (°C) | −0.8 (−18.2) |
7.0 (−13.9) |
12.9 (−10.6) |
17.2 (−8.2) |
23.7 (−4.6) |
31.5 (−0.3) |
39.7 (4.3) |
36.0 (2.2) |
26.7 (−2.9) |
15.2 (−9.3) |
6.1 (−14.4) |
−0.7 (−18.2) |
−7.0 (−21.7) |
| Record low °F (°C) | −30 (−34) |
−26 (−32) |
−1 (−18) |
7 (−14) |
15 (−9) |
23 (−5) |
32 (0) |
25 (−4) |
14 (−10) |
−5 (−21) |
−13 (−25) |
−35 (−37) |
−35 (−37) |
| Average precipitation inches (mm) | 1.26 (32) |
0.83 (21) |
1.04 (26) |
1.28 (33) |
1.31 (33) |
0.77 (20) |
0.21 (5.3) |
0.26 (6.6) |
0.51 (13) |
0.89 (23) |
0.72 (18) |
1.14 (29) |
10.22 (259.9) |
| Average snowfall inches (cm) | 4.9 (12) |
2.5 (6.4) |
1.4 (3.6) |
1.4 (3.6) |
0.1 (0.25) |
0.0 (0.0) |
0.0 (0.0) |
0.0 (0.0) |
0.0 (0.0) |
0.3 (0.76) |
1.1 (2.8) |
4.0 (10) |
15.7 (39.41) |
| Average precipitation days (≥ 0.01 in) | 6.5 | 6.1 | 6.6 | 6.5 | 6.9 | 3.5 | 1.9 | 1.8 | 2.3 | 3.7 | 5.0 | 6.7 | 57.5 |
| Average snowy days (≥ 0.1 in) | 1.9 | 1.4 | 0.5 | 0.5 | 0.0 | 0.0 | 0.0 | 0.0 | 0.0 | 0.1 | 0.6 | 2.0 | 7.0 |
| Source 1: NOAA | |||||||||||||
| Source 2: National Weather Service | |||||||||||||
Schools in Orovada
The Humboldt County School District manages the schools for children living in Orovada. Some students attend Orovada School, which teaches children from kindergarten to 8th grade. Other students in the area go to Kings River School, which also serves K-8 grades.
In 1954, Orovada School had 22 students. A new building, designed by Alegre and Hanson, opened in 1958. It was made from pumice, a light volcanic rock. This new school had two classrooms and two apartments for teachers. By the 1963-1964 school year, Orovada School had 50 students. In 1966, some parents wanted a new heating system for the school. They said their children would not attend if it wasn't fixed. Kings River School had 15 students during the 1963-1964 school year.
Famous People from Orovada
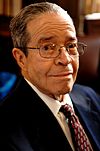
Rodeo announcer Bob Tallman spent his early childhood near Orovada. He lived on Willow Creek Ranch, about eight miles north of the community.
Population Information
| Historical population | |||
|---|---|---|---|
| Census | Pop. | %± | |
| 2020 | 117 | — | |
| U.S. Decennial Census | |||
See also
 In Spanish: Orovada (Nevada) para niños
 | Shirley Ann Jackson |
 | Garett Morgan |
 | J. Ernest Wilkins Jr. |
 | Elijah McCoy |


