
Rio Dell, California facts for kids
Quick facts for kids
Rio Dell, California
|
||
|---|---|---|
| City of Rio Dell | ||

Wildwood Avenue, Rio Dell
|
||
|
|
||

Location in Humboldt County and the state of California
|
||

Rio Dell, California
Location in California

Rio Dell, California
Location in the United States
|
||
| Country | United States | |
| State | California | |
| County | Humboldt | |
| Incorporated | February 23, 1965 | |
| Area | ||
| • Total | 2.42 sq mi (6.26 km2) | |
| • Land | 2.28 sq mi (5.91 km2) | |
| • Water | 0.14 sq mi (0.35 km2) 5.61% | |
| Elevation | 161 ft (49 m) | |
| Population
(2020)
|
||
| • Total | 3,379 | |
| • Estimate
(2019)
|
3,349 | |
| • Density | 1,468.22/sq mi (566.86/km2) | |
| Time zone | UTC-8 (Pacific (PST)) | |
| • Summer (DST) | UTC-7 (PDT) | |
| ZIP code |
95562
|
|
| Area code(s) | 707 | |
| FIPS code | 06-60900 | |
| GNIS feature IDs | 277614, 2410951 | |
Rio Dell is a city in Humboldt County, California, United States. Its name comes from two words: Río (Spanish for "river") and Dell (English for "small valley in a woodland"). The city is located on the west side of the Eel River. It is about 1 mile (1.6 km) north of Scotia. The city sits at an elevation of 161 feet (49 m) above sea level. In 2020, about 3,379 people lived in Rio Dell.
History of Rio Dell
How Rio Dell Got Its Name
The name Rio Dell comes from the old Rio Dell Hotel. The hotel owner, Lorenzo Painter, combined the Spanish word río (river) with the English word dell (a small wooded valley). This name describes the area well, with its river and green surroundings.
Early Days and Native Peoples
Before it was called Rio Dell, the area was home to several Native American tribes. These included the Wiyot, Nongatl, and Mattole tribes. They reportedly called the area "Tokemuk." After a difficult period for the native people, the area became known as Eagle Prairie. Eventually, it was renamed Rio Dell.
Connecting Communities
The first post office in Rio Dell opened in 1876. For a long time, a ferry connected Rio Dell to Scotia, helping lumber mill workers travel. After a flood destroyed the first bridge in 1905, ferries continued to operate. A new suspension bridge to Scotia was finally built in 1914.
Wildwood and the Lumber Industry
Many Italian immigrants settled in an area south of Rio Dell. This part of town was known as Wildwood, and sometimes as Little Italy. It became a popular place for mill workers. Rio Dell's main street is still called Wildwood Avenue today. In 1928, a big fire destroyed many buildings on this street.
Rio Dell became an important home for workers of the Pacific Lumber Company. This was one of the largest lumber mills in the world. Many immigrants, especially from Italy and Portugal, first settled here.
Becoming an Official City
Rio Dell officially became a city in 1965. This happened because the community was growing after World War II. Also, the local Sheriff's office found it hard to provide enough police services to the area. Becoming a city allowed Rio Dell to create its own police department. This gave the community more local control over safety.
However, over the next 20 years, the city faced some challenges. A new freeway bypass changed traffic patterns. Also, the Pacific Lumber Company eventually became a smaller employer. These changes affected the city's economy.
Recent Events
Rio Dell was affected by an earthquake in 2022. This event caused shaking and some damage in the area.
Geography and Climate
Where is Rio Dell Located?
Rio Dell covers a total area of about 2.4 square miles (6.2 square kilometers). Most of this area, about 2.3 square miles (5.9 square kilometers), is land. The rest, about 0.1 square miles (0.3 square kilometers), is water.
What is Rio Dell's Climate Like?
Rio Dell has a type of weather called a warm-summer Mediterranean climate. This means the summers are warm but not too hot, and they are usually dry. The average monthly temperatures do not go above 71.6°F (22°C). Winters are mild and wet.
| Climate data for Rio Dell | |||||||||||||
|---|---|---|---|---|---|---|---|---|---|---|---|---|---|
| Month | Jan | Feb | Mar | Apr | May | Jun | Jul | Aug | Sep | Oct | Nov | Dec | Year |
| Record high °F (°C) | 76 (24) |
82 (28) |
86 (30) |
90 (32) |
97 (36) |
98 (37) |
102 (39) |
96 (36) |
98 (37) |
97 (36) |
81 (27) |
73 (23) |
102 (39) |
| Mean daily maximum °F (°C) | 55.3 (12.9) |
57.4 (14.1) |
58.5 (14.7) |
60.3 (15.7) |
63.2 (17.3) |
66.3 (19.1) |
69.1 (20.6) |
70.3 (21.3) |
70.9 (21.6) |
67.3 (19.6) |
60.5 (15.8) |
55.6 (13.1) |
62.9 (17.2) |
| Daily mean °F (°C) | 47.8 (8.8) |
49.5 (9.7) |
50.4 (10.2) |
52.3 (11.3) |
55.5 (13.1) |
58.7 (14.8) |
60.9 (16.1) |
61.7 (16.5) |
60.9 (16.1) |
57.6 (14.2) |
52.4 (11.3) |
48.3 (9.1) |
54.7 (12.6) |
| Mean daily minimum °F (°C) | 40.3 (4.6) |
41.6 (5.3) |
42.6 (5.9) |
44.3 (6.8) |
47.7 (8.7) |
51.1 (10.6) |
52.8 (11.6) |
53.1 (11.7) |
50.9 (10.5) |
47.8 (8.8) |
44.2 (6.8) |
41.1 (5.1) |
46.4 (8.0) |
| Record low °F (°C) | 20 (−7) |
23 (−5) |
29 (−2) |
32 (0) |
33 (1) |
40 (4) |
40 (4) |
41 (5) |
37 (3) |
28 (−2) |
27 (−3) |
17 (−8) |
41 (5) |
| Average precipitation inches (mm) | 8.8 (220) |
7.5 (190) |
6.5 (170) |
3.5 (89) |
1.7 (43) |
0.6 (15) |
0.1 (2.5) |
0.2 (5.1) |
0.6 (15) |
3.0 (76) |
6.4 (160) |
9.2 (230) |
48.1 (1,220) |
| Average precipitation days | 16 | 15 | 15 | 12 | 9 | 5 | 2 | 2 | 3 | 8 | 14 | 16 | 117 |
Population and People
How Many People Live in Rio Dell?
| Historical population | |||
|---|---|---|---|
| Census | Pop. | %± | |
| 1890 | 213 | — | |
| 1950 | 1,862 | — | |
| 1960 | 3,222 | 73.0% | |
| 1970 | 2,817 | −12.6% | |
| 1980 | 2,687 | −4.6% | |
| 1990 | 3,012 | 12.1% | |
| 2000 | 3,174 | 5.4% | |
| 2010 | 3,368 | 6.1% | |
| 2020 | 3,379 | 0.3% | |
| U.S. Decennial Census | |||
The population of Rio Dell has changed over the years. In 1890, only 213 people lived there. By 2020, the population had grown to 3,379 people.
A Look at the 2010 Census
In 2010, the census counted 3,368 people in Rio Dell. Most people, about 85.9%, were White. About 3.7% were Native American, and 0.7% were Asian. People of Hispanic or Latino background made up about 11.4% of the population.
Most people (99.4%) lived in homes with their families or housemates. There were 1,367 households in total. About 32.2% of these households had children under 18 living there. The average household had about 2.45 people.
The median age in Rio Dell in 2010 was 38.3 years. This means half the people were younger than 38.3, and half were older. About 23.8% of the population was under 18 years old. About 13.2% of the population was 65 or older.
More than half of the homes (56.6%) were owned by the people living in them. The rest were rented.
A Look at the 2000 Census
In 2000, Rio Dell had 3,174 people living in 1,221 households. The racial makeup was similar to 2010, with about 85.63% White residents. About 10.81% of the population was Hispanic or Latino.
The median income for a household in 2000 was $29,254. The median income for a family was $36,464. About 23.1% of the population lived below the poverty line. This included 31.1% of those under 18.
Images for kids
-
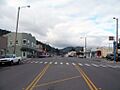
Wildwood Avenue, Rio Dell
-

City of Rio Dell Logo
-
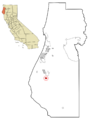
Location in Humboldt County and the state of California
See also
 In Spanish: Río Dell (California) para niños
