
Rupert, West Virginia facts for kids
Quick facts for kids
Rupert, West Virginia
|
|
|---|---|

Nicholas Street (U.S. Route 60)
|
|

Location of Rupert in Greenbrier County, West Virginia.
|
|
| Country | United States |
| State | West Virginia |
| County | Greenbrier |
| Area | |
| • Total | 0.78 sq mi (2.03 km2) |
| • Land | 0.77 sq mi (1.99 km2) |
| • Water | 0.01 sq mi (0.04 km2) |
| Elevation | 2,425 ft (739 m) |
| Population
(2020)
|
|
| • Total | 881 |
| • Estimate
(2021)
|
867 |
| • Density | 1,165.58/sq mi (449.78/km2) |
| Time zone | UTC-5 (Eastern (EST)) |
| • Summer (DST) | UTC-4 (EDT) |
| ZIP code |
25984
|
| Area code(s) | 304 |
| FIPS code | 54-70828 |
| GNIS feature ID | 2391398 |
Rupert is a small town located in Greenbrier County, West Virginia, in the United States. In 2020, about 881 people lived there. It's a quiet place with a rich history and interesting geography.
Contents
History of Rupert
Rupert, West Virginia, got its name from a man named Cyrus A. Rupert. He moved to Greenbrier County around 1829 when he was 17 years old. Cyrus was born in Point Pleasant in 1812.
How Rupert Started
Cyrus Rupert became good friends with Andrew McClung. Through this friendship, Cyrus began to buy land near a place called Big Clear Creek. This land eventually became the foundation for the town we now know as Rupert.
Geography of Rupert
Rupert is located in West Virginia. It covers a total area of about 0.79 square miles (2.03 square kilometers). Most of this area is land, with a very small part being water.
Climate in Rupert
The weather in Rupert, West Virginia, changes throughout the year. Summers are generally warm, and winters can be cold with snow. The area gets a good amount of rain and snowfall each year.
| Climate data for Rupert, West Virginia, 1991–2020 normals, extremes 1989–present: 3319ft (1012m) | |||||||||||||
|---|---|---|---|---|---|---|---|---|---|---|---|---|---|
| Month | Jan | Feb | Mar | Apr | May | Jun | Jul | Aug | Sep | Oct | Nov | Dec | Year |
| Record high °F (°C) | 67 (19) |
71 (22) |
81 (27) |
83 (28) |
89 (32) |
88 (31) |
94 (34) |
91 (33) |
89 (32) |
86 (30) |
76 (24) |
70 (21) |
94 (34) |
| Mean maximum °F (°C) | 56.0 (13.3) |
59.6 (15.3) |
68.8 (20.4) |
78.3 (25.7) |
81.9 (27.7) |
83.1 (28.4) |
84.9 (29.4) |
84.5 (29.2) |
82.7 (28.2) |
76.3 (24.6) |
67.7 (19.8) |
56.7 (13.7) |
86.4 (30.2) |
| Mean daily maximum °F (°C) | 34.2 (1.2) |
37.8 (3.2) |
46.4 (8.0) |
58.7 (14.8) |
67.1 (19.5) |
73.1 (22.8) |
76.6 (24.8) |
75.9 (24.4) |
70.5 (21.4) |
60.0 (15.6) |
47.8 (8.8) |
38.1 (3.4) |
57.2 (14.0) |
| Daily mean °F (°C) | 26.4 (−3.1) |
29.2 (−1.6) |
37.4 (3.0) |
48.4 (9.1) |
56.9 (13.8) |
63.8 (17.7) |
67.3 (19.6) |
66.6 (19.2) |
60.9 (16.1) |
50.1 (10.1) |
39.2 (4.0) |
30.7 (−0.7) |
48.1 (8.9) |
| Mean daily minimum °F (°C) | 18.6 (−7.4) |
20.6 (−6.3) |
28.3 (−2.1) |
38.0 (3.3) |
46.8 (8.2) |
54.5 (12.5) |
58.1 (14.5) |
57.4 (14.1) |
51.3 (10.7) |
40.2 (4.6) |
30.5 (−0.8) |
23.3 (−4.8) |
39.0 (3.9) |
| Mean minimum °F (°C) | −2.3 (−19.1) |
1.8 (−16.8) |
8.0 (−13.3) |
19.6 (−6.9) |
31.3 (−0.4) |
42.8 (6.0) |
48.9 (9.4) |
47.6 (8.7) |
37.0 (2.8) |
24.2 (−4.3) |
12.9 (−10.6) |
5.4 (−14.8) |
−5.9 (−21.1) |
| Record low °F (°C) | −25 (−32) |
−14 (−26) |
−3 (−19) |
9 (−13) |
21 (−6) |
33 (1) |
44 (7) |
38 (3) |
27 (−3) |
15 (−9) |
0 (−18) |
−12 (−24) |
−25 (−32) |
| Average precipitation inches (mm) | 4.09 (104) |
4.02 (102) |
5.09 (129) |
4.43 (113) |
5.58 (142) |
4.78 (121) |
5.41 (137) |
4.18 (106) |
3.92 (100) |
3.14 (80) |
3.98 (101) |
4.72 (120) |
53.34 (1,355) |
| Average snowfall inches (cm) | 22.3 (57) |
24.3 (62) |
17.5 (44) |
4.2 (11) |
0.0 (0.0) |
0.0 (0.0) |
0.0 (0.0) |
0.0 (0.0) |
0.0 (0.0) |
0.6 (1.5) |
4.5 (11) |
20.0 (51) |
93.4 (237.5) |
| Average extreme snow depth inches (cm) | 11.3 (29) |
14.0 (36) |
10.7 (27) |
2.3 (5.8) |
0.1 (0.25) |
0.0 (0.0) |
0.0 (0.0) |
0.0 (0.0) |
0.0 (0.0) |
0.5 (1.3) |
2.7 (6.9) |
8.0 (20) |
19.7 (50) |
| Average precipitation days (≥ 0.01 in) | 16.9 | 14.5 | 14.8 | 13.7 | 14.3 | 12.9 | 12.3 | 11.2 | 8.9 | 9.8 | 11.1 | 15.0 | 155.4 |
| Average snowy days (≥ 0.1 in) | 9.2 | 7.7 | 5.7 | 1.7 | 0.0 | 0.0 | 0.0 | 0.0 | 0.0 | 0.4 | 2.2 | 7.3 | 34.2 |
| Source 1: NOAA | |||||||||||||
| Source 2: XMACIS (snowfall, temp records & monthly max/mins) | |||||||||||||
Population of Rupert
The number of people living in Rupert has changed over the years. Here's a look at the population from different census records.
| Historical population | |||
|---|---|---|---|
| Census | Pop. | %± | |
| 1950 | 952 | — | |
| 1960 | 921 | −3.3% | |
| 1970 | 1,027 | 11.5% | |
| 1980 | 1,276 | 24.2% | |
| 1990 | 1,104 | −13.5% | |
| 2000 | 940 | −14.9% | |
| 2010 | 942 | 0.2% | |
| 2020 | 881 | −6.5% | |
| 2021 (est.) | 867 | −8.0% | |
| U.S. Decennial Census | |||
Rupert's Population in 2010
In 2010, there were 942 people living in Rupert. These people lived in 431 households. A household is a group of people living together in one home.
- Most people in Rupert (98.8%) were White.
- About 24.6% of households had children under 18.
- The average age of people in Rupert was 44.8 years old.
- About 21.4% of residents were under 18.
- Roughly 20.8% of residents were 65 or older.
Famous People from Rupert
- Max Hayslette (born 1929) is a well-known painter, exhibit designer, and graphic artist who was born in Rupert.
Images for kids
-
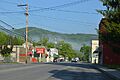
Nicholas Street (U.S. Route 60)
-

Location of Rupert in Greenbrier County, West Virginia.
See also
 In Spanish: Rupert (Virginia Occidental) para niños
