
San Jon, New Mexico facts for kids
Quick facts for kids
San Jon, New Mexico
|
|
|---|---|
|
Village
|
|

Water tower in San Jon
|
|

Location of San Jon, New Mexico
|
|

San Jon, New Mexico
Location in the United States
|
|
| Country | |
| State | |
| County | Quay |
| Area | |
| • Total | 2.93 sq mi (7.58 km2) |
| • Land | 2.93 sq mi (7.58 km2) |
| • Water | 0.00 sq mi (0.00 km2) |
| Elevation | 4,029 ft (1,228 m) |
| Population
(2020)
|
|
| • Total | 195 |
| • Density | 66.60/sq mi (25.71/km2) |
| Time zone | UTC-7 (Mountain (MST)) |
| • Summer (DST) | UTC-6 (MDT) |
| ZIP codes |
88411, 88434
|
| Area code(s) | 575 |
| FIPS code | 35-68150 |
| GNIS feature ID | 2413587 |
San Jon is a small village in Quay County, New Mexico, United States. In 2020, about 195 people lived there.
History of San Jon
San Jon was started in 1902. It grew a lot when the railroad arrived in 1904. For many years, it was an important place for businesses. It was also a popular stop on the famous U.S. Route 66. Many travelers stopped there for gas, food, and a place to sleep. There were gas stations, cafes, and motels.
However, things changed in 1981. A new highway, Interstate 40, was built around the village. This meant that most travelers no longer drove through San Jon. Because of this, many businesses had to close down. Today, only one motel is still open. Most of the gas stations and places to eat are now near the I-40 exit. Some old places that closed include The Old Route 66 Truck and Auto Parts garage, Smith's Café, and the Circle M Motel.
Geography of San Jon
San Jon is located in New Mexico. It covers an area of about 2.6 square miles (7.58 square kilometers). All of this area is land.
The village is right next to I-40. It is also where New Mexico State Highway 469 crosses I-40. San Jon is east of a larger town called Tucumcari.
-
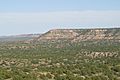
The northern edge of the Llano Estacado, a large flat area, is south of San Jon.
-
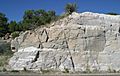
This picture shows a road cut on Highway 469 as it goes over the edge of the Llano Estacado.
-
A view of San Jon, looking north from the high ground of the Llano Estacado.
-

This motel in San Jon has been open since 1946.


San Jon's Climate
San Jon has a "cold semi-arid climate." This means it is usually dry, but not extremely hot all the time. It can get very hot in summer and very cold in winter. The hottest temperature ever recorded was 111°F (44°C) in July 2020. The coldest temperature ever recorded was -20°F (-29°C) in January 1919.
| Climate data for San Jon, New Mexico, 1991–2020 normals, extremes 1907–2021 | |||||||||||||
|---|---|---|---|---|---|---|---|---|---|---|---|---|---|
| Month | Jan | Feb | Mar | Apr | May | Jun | Jul | Aug | Sep | Oct | Nov | Dec | Year |
| Record high °F (°C) | 83 (28) |
86 (30) |
91 (33) |
98 (37) |
104 (40) |
110 (43) |
111 (44) |
108 (42) |
105 (41) |
98 (37) |
91 (33) |
80 (27) |
111 (44) |
| Mean maximum °F (°C) | 71.8 (22.1) |
76.2 (24.6) |
83.8 (28.8) |
88.5 (31.4) |
95.9 (35.5) |
103.1 (39.5) |
102.9 (39.4) |
100.8 (38.2) |
96.9 (36.1) |
89.9 (32.2) |
80.7 (27.1) |
72.6 (22.6) |
105.1 (40.6) |
| Mean daily maximum °F (°C) | 54.9 (12.7) |
59.4 (15.2) |
67.5 (19.7) |
75.2 (24.0) |
83.9 (28.8) |
93.4 (34.1) |
95.3 (35.2) |
93.3 (34.1) |
86.8 (30.4) |
75.9 (24.4) |
64.1 (17.8) |
54.5 (12.5) |
75.3 (24.1) |
| Daily mean °F (°C) | 40.2 (4.6) |
43.9 (6.6) |
51.6 (10.9) |
59.2 (15.1) |
68.3 (20.2) |
77.7 (25.4) |
81.0 (27.2) |
79.2 (26.2) |
72.3 (22.4) |
60.7 (15.9) |
49.1 (9.5) |
40.3 (4.6) |
60.3 (15.7) |
| Mean daily minimum °F (°C) | 25.5 (−3.6) |
28.4 (−2.0) |
35.6 (2.0) |
43.2 (6.2) |
52.6 (11.4) |
62.1 (16.7) |
66.6 (19.2) |
65.2 (18.4) |
57.9 (14.4) |
45.4 (7.4) |
34.2 (1.2) |
26.0 (−3.3) |
45.2 (7.3) |
| Mean minimum °F (°C) | 8.9 (−12.8) |
11.8 (−11.2) |
17.6 (−8.0) |
26.8 (−2.9) |
36.6 (2.6) |
50.6 (10.3) |
58.4 (14.7) |
56.9 (13.8) |
43.1 (6.2) |
27.9 (−2.3) |
16.7 (−8.5) |
7.7 (−13.5) |
3.9 (−15.6) |
| Record low °F (°C) | −20 (−29) |
−19 (−28) |
−9 (−23) |
8 (−13) |
21 (−6) |
35 (2) |
48 (9) |
45 (7) |
30 (−1) |
11 (−12) |
−5 (−21) |
−15 (−26) |
−20 (−29) |
| Average precipitation inches (mm) | 0.66 (17) |
0.43 (11) |
1.09 (28) |
1.09 (28) |
1.77 (45) |
2.14 (54) |
2.69 (68) |
2.42 (61) |
1.40 (36) |
1.73 (44) |
0.72 (18) |
0.82 (21) |
16.96 (431) |
| Average snowfall inches (cm) | 4.3 (11) |
1.8 (4.6) |
2.1 (5.3) |
0.9 (2.3) |
0.1 (0.25) |
0.0 (0.0) |
0.0 (0.0) |
0.0 (0.0) |
0.0 (0.0) |
0.5 (1.3) |
2.0 (5.1) |
5.4 (14) |
17.1 (43.85) |
| Average precipitation days (≥ 0.01 in) | 2.7 | 2.4 | 3.2 | 3.2 | 4.7 | 6.1 | 6.7 | 7.2 | 4.6 | 3.8 | 2.7 | 3.4 | 50.7 |
| Average snowy days (≥ 0.1 in) | 1.4 | 1.0 | 0.6 | 0.4 | 0.0 | 0.0 | 0.0 | 0.0 | 0.0 | 0.2 | 0.7 | 2.1 | 6.4 |
| Source 1: NOAA | |||||||||||||
| Source 2: National Weather Service | |||||||||||||
Population of San Jon
| Historical population | |||
|---|---|---|---|
| Census | Pop. | %± | |
| 1950 | 362 | — | |
| 1960 | 411 | 13.5% | |
| 1970 | 308 | −25.1% | |
| 1980 | 341 | 10.7% | |
| 1990 | 277 | −18.8% | |
| 2000 | 306 | 10.5% | |
| 2010 | 216 | −29.4% | |
| 2020 | 195 | −9.7% | |
| U.S. Decennial Census | |||
In the year 2000, 306 people lived in San Jon. There were 118 homes. Most people were White, and some were Native American or from other backgrounds. About 32% of the people were Hispanic or Latino.
About 30% of the people living in San Jon were under 18 years old. The average age of people in the village was 36 years.
See also
 In Spanish: San Jon para niños
