San José de Maipo facts for kids
Quick facts for kids
San José de Maipo
|
|||||
|---|---|---|---|---|---|

Maitenes range
|
|||||
|
|||||
| Country | Chile | ||||
| Region | Santiago Metro. | ||||
| Province | Cordillera | ||||
| Government | |||||
| • Type | Municipality | ||||
| Area | |||||
| • Total | 4,994.8 km2 (1,928.5 sq mi) | ||||
| Area rank | 1 | ||||
| Population
(2002 Census)
|
|||||
| • Total | 13,376 | ||||
| • Rank | 3 | ||||
| • Density | 2.67799/km2 (6.9359/sq mi) | ||||
| • Urban | 9,311 | ||||
| • Rural | 4,065 | ||||
| Sex | |||||
| • Men | 6,947 | ||||
| • Women | 6,429 | ||||
| Time zone | UTC-4 (CLT) | ||||
| • Summer (DST) | UTC-3 (CLST) | ||||
| Area code(s) | 56 + 53 | ||||
| Website | Municipality of San José de Maipo | ||||
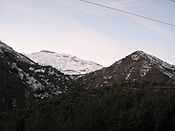
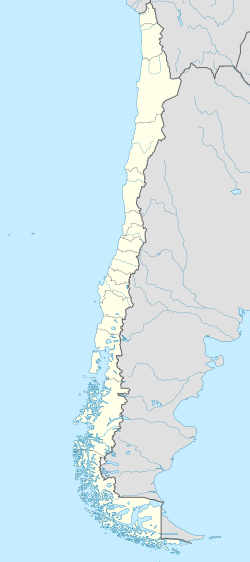
San José de Maipo is a town and commune in Chile. It is located in the Cordillera Province of the Santiago Metropolitan Region. The town is about 48 kilometers (30 miles) southeast of Santiago, the capital city. To its east, it shares a border with Argentina, right across the amazing Andes mountains.
Contents
People and Population
In 2002, a study counted the people living in San José de Maipo. The area covers about 4,994.8 square kilometers (1,928.5 square miles). At that time, 13,376 people lived there. This included 6,947 men and 6,429 women.
Most of the people, about 9,311 (69.6%), lived in urban areas, which are towns or cities. The rest, 4,065 people (30.4%), lived in rural areas, like the countryside. Between 1992 and 2002, the number of people living in San José de Maipo grew by 14.9%. This means 1,730 more people moved there. The area has fewer people per square kilometer compared to other places in the region.
What People Do for Work
The economy in San José de Maipo has many interesting parts. People work in mining, especially for non-metal materials like stone. They also grow crops like almonds and other fruits with hard pits. Local artists create beautiful crafts using special rocks called laja rock and alabaster.
Tourism is very important here. Many visitors come to enjoy the area. There are lots of places to eat and stay. In 2001, the government officially called San José de Maipo a "National Tourist Interest Zone." This shows how special it is for visitors.
History of San José de Maipo
San José de Maipo became an official town in 1792. This happened because Ambrosio O'Higgins, who was in charge of Chile, thought it was important. He wanted to support the mining that was happening nearby.
In the 1800s, the area was important for Chile's independence. General San Martin and his army used this path to help Chile become free from Spain. This was because it was close to Argentina.
Later, in the 1900s, San José de Maipo became very important for Santiago. The first power plant that used water to make electricity was built here. It was called Maitenes. Also, a special water channel was built. This channel brings clean drinking water from the Andean glaciers to Santiago.
Because the air is so clean, hospitals for people with breathing problems were built here. Towards the end of the 1900s, ecotourism became popular. The Maipo river is great for white water rafting, which brings many adventurers.
How the Town is Run
San José de Maipo is a commune, which is like a local government area. It is managed by a group called the municipal council. The leader of this council is called an alcalde, which means mayor. The mayor is chosen by the people in an election every four years.
From 2012 to 2016, the mayor was Luis Pezoa Álvarez. The council members who worked with him were Maite Birke Abaroa, Andrés Venegas Veliz, Marco Quintanilla Pizarro, Andy Ortiz Apablaza, Eduardo Astorga Flores, and Carmen Larenas Whipple.
For voting in national elections, San José de Maipo is part of a larger area. This area also includes Puente Alto, Pirque, and La Pintana. People from this area vote for representatives in the national government.
Climate and Weather
The climate in San José de Maipo changes throughout the year. Summers are generally warm, and winters are cool. The area gets some rain, especially in the cooler months. The weather box below shows more details about the temperatures and rainfall.
| Climate data for San José de Maipo, elevation 1,060 m (3,480 ft) | |||||||||||||
|---|---|---|---|---|---|---|---|---|---|---|---|---|---|
| Month | Jan | Feb | Mar | Apr | May | Jun | Jul | Aug | Sep | Oct | Nov | Dec | Year |
| Mean daily maximum °C (°F) | 27.8 (82.0) |
27.1 (80.8) |
25.3 (77.5) |
22.3 (72.1) |
18.2 (64.8) |
15.5 (59.9) |
15.5 (59.9) |
16.0 (60.8) |
18.5 (65.3) |
20.6 (69.1) |
23.8 (74.8) |
27.0 (80.6) |
21.5 (70.6) |
| Daily mean °C (°F) | 18.9 (66.0) |
17.8 (64.0) |
15.7 (60.3) |
12.9 (55.2) |
10.4 (50.7) |
7.8 (46.0) |
7.7 (45.9) |
7.9 (46.2) |
10.2 (50.4) |
12.6 (54.7) |
15.3 (59.5) |
18.1 (64.6) |
12.9 (55.3) |
| Mean daily minimum °C (°F) | 10.6 (51.1) |
10.2 (50.4) |
8.3 (46.9) |
6.1 (43.0) |
4.9 (40.8) |
2.5 (36.5) |
2.4 (36.3) |
2.4 (36.3) |
4.1 (39.4) |
5.6 (42.1) |
7.4 (45.3) |
9.4 (48.9) |
6.2 (43.1) |
| Average precipitation mm (inches) | 4.9 (0.19) |
6.0 (0.24) |
6.7 (0.26) |
25.7 (1.01) |
132.9 (5.23) |
139.8 (5.50) |
114.4 (4.50) |
99.9 (3.93) |
48.4 (1.91) |
27.4 (1.08) |
12.1 (0.48) |
5.0 (0.20) |
623.2 (24.53) |
| Average relative humidity (%) | 55 | 59 | 58 | 56 | 63 | 63 | 62 | 65 | 64 | 62 | 56 | 52 | 60 |
| Source: Bioclimatografia de Chile | |||||||||||||
See also
 In Spanish: San José de Maipo para niños
 | Aurelia Browder |
 | Nannie Helen Burroughs |
 | Michelle Alexander |


