Soda Springs, Nevada County, California facts for kids
Quick facts for kids
Soda Springs
|
|
|---|---|

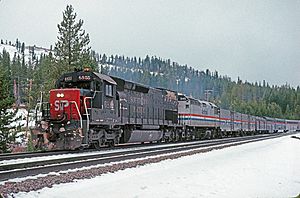
The Amtrak San Francisco Zephyr at Soda Springs
|
|
| Country | |
| State | |
| County | Nevada |
| Area | |
| • Total | 0.339 sq mi (0.879 km2) |
| • Land | 0.339 sq mi (0.879 km2) |
| • Water | 0 sq mi (0 km2) 0% |
| Elevation | 6,768 ft (2,063 m) |
| Population
(2010)
|
|
| • Total | 81 |
| • Density | 238.9/sq mi (92.2/km2) |
| Time zone | UTC-8 (Pacific (PST)) |
| • Summer (DST) | UTC-7 (PDT) |
| ZIP code |
95728, 95724
|
| Area code(s) | 530 |
| GNIS feature IDs | 234848; 2628790 |
Soda Springs is a small community in Nevada County, California, United States. It's located about 3 miles (4.8 km) west of Donner Pass. In 2010, 81 people lived there.
This area has been known by several other names over time, including Summit Valley, Soda Springs Station, Hopkins, Hopkins Springs, and Tinkers Station.
A popular spot in the area is the Soda Springs Ski Resort, which is right off Highway 80 near the Donner Summit.
Contents
History of Soda Springs
Early Days and Resorts
In the 1880s, two important people, Mark Hopkins and Leland Stanford, started a resort here. They helped make the area a place for people to visit and relax.
Post Offices and Names
The first post office in the area opened in 1870 and was called Summit Valley. Its name changed to Soda Springs in 1875. It closed for a while in 1881 but reopened in 1929. Another post office, called Hopkins, was open from 1885 to 1886.
Railroad Connection
From 1867 to 1873, the Central Pacific Railroad had a station here called Tinkers Station. This name honored J.A. Tinker, who was known for hauling goods between the mines and Soda Springs.
Geography and Location
Soda Springs is a small place, covering about 0.3 square miles (0.9 square kilometers) of land. It's nestled in the beautiful natural landscape of California.
Climate and Snowfall
Soda Springs has a type of climate called a dry-summer continental climate. This means it has warm, dry summers and very cold, snowy winters. It's known for getting a lot of snow!
In fact, Soda Springs is the snowiest place in California. The snow can get very deep, sometimes reaching over 93 inches (236.2 cm) in March. This makes it one of the snowiest communities in the world.
| Climate data for Soda Springs, California, 1991–2020 normals, extremes 1913–1959 | |||||||||||||
|---|---|---|---|---|---|---|---|---|---|---|---|---|---|
| Month | Jan | Feb | Mar | Apr | May | Jun | Jul | Aug | Sep | Oct | Nov | Dec | Year |
| Record high °F (°C) | 61 (16) |
65 (18) |
64 (18) |
72 (22) |
79 (26) |
88 (31) |
91 (33) |
88 (31) |
92 (33) |
78 (26) |
72 (22) |
67 (19) |
92 (33) |
| Mean maximum °F (°C) | 52.9 (11.6) |
54.0 (12.2) |
57.7 (14.3) |
63.7 (17.6) |
71.2 (21.8) |
79.3 (26.3) |
84.5 (29.2) |
83.0 (28.3) |
80.3 (26.8) |
73.0 (22.8) |
64.5 (18.1) |
58.0 (14.4) |
85.9 (29.9) |
| Mean daily maximum °F (°C) | 36.9 (2.7) |
39.2 (4.0) |
42.9 (6.1) |
49.5 (9.7) |
55.9 (13.3) |
64.4 (18.0) |
73.8 (23.2) |
73.4 (23.0) |
68.3 (20.2) |
57.9 (14.4) |
47.5 (8.6) |
40.7 (4.8) |
54.2 (12.3) |
| Daily mean °F (°C) | 24.9 (−3.9) |
26.5 (−3.1) |
30.0 (−1.1) |
36.7 (2.6) |
43.1 (6.2) |
51.1 (10.6) |
59.0 (15.0) |
57.7 (14.3) |
53.4 (11.9) |
44.8 (7.1) |
35.0 (1.7) |
28.1 (−2.2) |
40.9 (4.9) |
| Mean daily minimum °F (°C) | 12.6 (−10.8) |
13.6 (−10.2) |
17.1 (−8.3) |
23.9 (−4.5) |
30.3 (−0.9) |
37.8 (3.2) |
44.2 (6.8) |
42.0 (5.6) |
37.9 (3.3) |
31.0 (−0.6) |
22.0 (−5.6) |
15.3 (−9.3) |
27.3 (−2.6) |
| Mean minimum °F (°C) | −6.7 (−21.5) |
−7.3 (−21.8) |
−1.7 (−18.7) |
9.3 (−12.6) |
19.4 (−7.0) |
28.4 (−2.0) |
36.8 (2.7) |
34.9 (1.6) |
27.8 (−2.3) |
19.7 (−6.8) |
6.1 (−14.4) |
−4.3 (−20.2) |
−11.9 (−24.4) |
| Record low °F (°C) | −24 (−31) |
−28 (−33) |
−20 (−29) |
−10 (−23) |
2 (−17) |
21 (−6) |
23 (−5) |
24 (−4) |
20 (−7) |
6 (−14) |
−6 (−21) |
−17 (−27) |
−28 (−33) |
| Average precipitation inches (mm) | 13.16 (334) |
12.26 (311) |
12.14 (308) |
6.99 (178) |
4.74 (120) |
1.57 (40) |
0.43 (11) |
0.45 (11) |
0.99 (25) |
3.89 (99) |
7.57 (192) |
14.35 (364) |
78.54 (1,993) |
| Average snowfall inches (cm) | 73.0 (185) |
84.2 (214) |
105.7 (268) |
41.2 (105) |
15.6 (40) |
1.8 (4.6) |
0.0 (0.0) |
0.0 (0.0) |
1.5 (3.8) |
9.9 (25) |
42.8 (109) |
69.3 (176) |
445.0 (1,130) |
| Average extreme snow depth inches (cm) | 74 (190) |
90 (230) |
108 (270) |
90 (230) |
46 (120) |
15 (38) |
0 (0) |
0 (0) |
1 (2.5) |
6 (15) |
17 (43) |
49 (120) |
118 (300) |
| Average precipitation days (≥ 0.01 in) | 12.2 | 11.6 | 15.9 | 11.2 | 10.8 | 5.5 | 1.8 | 2.8 | 3.8 | 5.9 | 9.3 | 14.1 | 104.9 |
| Average snowy days (≥ 0.1 in) | 10.0 | 10.6 | 13.5 | 7.7 | 3.6 | 0.7 | 0.0 | 0.0 | 0.6 | 1.8 | 6.7 | 11.5 | 66.7 |
| Source: NOAA | |||||||||||||
People of Soda Springs
Population Overview
In 2010, the population of Soda Springs was 81 people. Most of the residents were White (97.5%), and a small number were Native American (2.5%). About 8.6% of the population identified as Hispanic or Latino.
Households and Families
There were 41 households in Soda Springs. About 14.6% of these households had children under 18 living in them. The average household had about 2 people. There were 15 families, with an average of 2.33 people per family.
Many households (41.5%) were made up of single individuals. About half of the homes (51.2%) were owned by the people living in them, and the other half (48.8%) were rented.
Age Distribution
The population of Soda Springs had people of all ages. About 11.1% were under 18 years old, and 9.9% were 65 years or older. The largest group, 42.0%, was between 25 and 44 years old. The average age in Soda Springs was 35.8 years.
See also
 In Spanish: Soda Springs (California) para niños


