South Salem, Ohio facts for kids
Quick facts for kids
South Salem, Ohio
|
|
|---|---|
|
Village
|
|

|
|

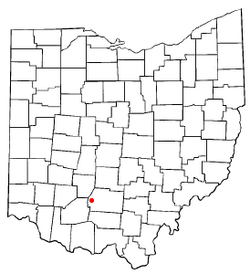
Location of South Salem, Ohio
|
|

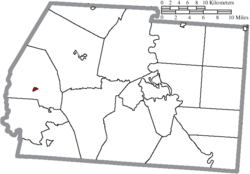
Location of South Salem in Ross County
|
|
| Country | United States |
| State | Ohio |
| County | Ross |
| Area | |
| • Total | 0.18 sq mi (0.47 km2) |
| • Land | 0.18 sq mi (0.47 km2) |
| • Water | 0.00 sq mi (0.00 km2) |
| Elevation | 925 ft (282 m) |
| Population
(2020)
|
|
| • Total | 219 |
| • Density | 1,216.67/sq mi (469.94/km2) |
| Time zone | UTC-5 (Eastern (EST)) |
| • Summer (DST) | UTC-4 (EDT) |
| ZIP code |
45681
|
| Area code(s) | 740 |
| FIPS code | 39-73698 |
| GNIS feature ID | 2399858 |
South Salem is a small village located in Ross County, Ohio, in the United States. In 2020, about 219 people lived there.
Contents
History of South Salem
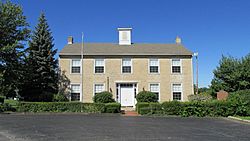
South Salem started because of a school! In 1842, a local minister named Hugh Stewart Fullerton helped create a school called the "Salem Academy." This school was the main reason the village grew.
How South Salem Was Founded
To help the students and teachers of the new school, a landowner named John Sample planned out the village of South Salem in 1846. This planning is called "platting." The village grew quickly for about two years. It soon had everything the school and its people needed.
Growth and Changes Over Time
After its fast start, the village's growth slowed down. South Salem officially became a village in the 1870s. This meant it could govern itself. Not many big changes happened in the late 1800s. By 1917, the village had about 350 to 400 people, a size it had kept since the 1850s.
The South Salem Academy closed in 1907. Other schools nearby offered more choices, and the academy couldn't compete. Since the school closed, the number of people living in South Salem has slowly gone down.
Geography of South Salem
South Salem is a very small village. The United States Census Bureau says that the village covers a total area of about 0.21 square miles (0.54 square kilometers). All of this area is land, with no water.
Population of South Salem
The number of people living in South Salem has changed over the years. Here's a look at the population from different census counts:
| Historical population | |||
|---|---|---|---|
| Census | Pop. | %± | |
| 1850 | 479 | — | |
| 1860 | 318 | −33.6% | |
| 1880 | 299 | — | |
| 1890 | 263 | −12.0% | |
| 1900 | 264 | 0.4% | |
| 1910 | 211 | −20.1% | |
| 1920 | 193 | −8.5% | |
| 1930 | 201 | 4.1% | |
| 1940 | 185 | −8.0% | |
| 1950 | 206 | 11.4% | |
| 1960 | 180 | −12.6% | |
| 1970 | 209 | 16.1% | |
| 1980 | 252 | 20.6% | |
| 1990 | 227 | −9.9% | |
| 2000 | 213 | −6.2% | |
| 2010 | 204 | −4.2% | |
| 2020 | 219 | 7.4% | |
| U.S. Decennial Census | |||
South Salem in 2010
In 2010, the census counted 204 people living in South Salem. There were 80 households, and 58 of these were families. The village had about 971 people per square mile.
Many households had children under 18 living with them. Most households were married couples living together. Some households were led by a single parent. The average household had about 2.55 people. The average family had about 2.90 people.
The average age of people in the village was 42 years old. About 23% of residents were under 18. About 12% were 65 years old or older. The village had slightly more females (51%) than males (49%).
See also

- In Spanish: South Salem (Ohio) para niños

