South Solon, Ohio facts for kids
Quick facts for kids
South Solon, Ohio
|
|
|---|---|
|
Village
|
|

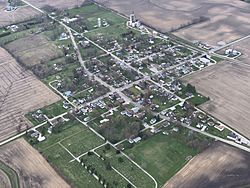
South Solon from the air
|
|

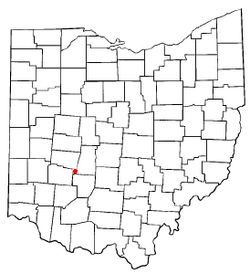
Location of South Solon, Ohio
|
|

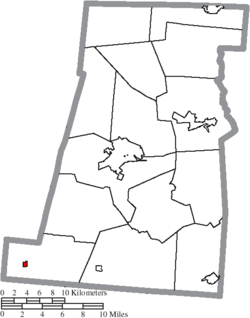
Location of South Solon in Madison County
|
|
| Country | United States |
| State | Ohio |
| County | Madison |
| Area | |
| • Total | 0.23 sq mi (0.61 km2) |
| • Land | 0.23 sq mi (0.61 km2) |
| • Water | 0.00 sq mi (0.00 km2) |
| Elevation | 1,112 ft (339 m) |
| Population
(2020)
|
|
| • Total | 329 |
| • Density | 1,400.00/sq mi (539.91/km2) |
| Time zone | UTC-5 (Eastern (EST)) |
| • Summer (DST) | UTC-4 (EDT) |
| ZIP code |
43153
|
| Area code(s) | 740 |
| FIPS code | 39-73768 |
| GNIS feature ID | 2399859 |
South Solon is a small village located in Madison County, Ohio, United States. In 2020, about 329 people lived there. It's important to know that South Solon is not near the city of Solon, Ohio, which is a suburb of Cleveland. The two places are actually very far apart, about 170 miles (274 kilometers).
Contents
History of South Solon
In 1875, South Solon was a small community. It had a post office, a grocery store, and a blacksmith shop. A blacksmith is someone who makes and repairs things out of iron.
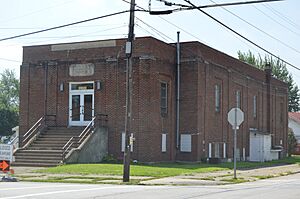
The village's community building was built in 1938. It was constructed by the Public Works Administration, which was a government program in the United States. This program helped create jobs during a tough economic time. The building cost about $25,454 to build.
Geography of South Solon
South Solon is a small village. According to the United States Census Bureau, the village covers a total area of about 0.25 square miles (0.65 square kilometers). All of this area is land, meaning there are no large bodies of water within the village limits.
Population and People
| Historical population | |||
|---|---|---|---|
| Census | Pop. | %± | |
| 1880 | 262 | — | |
| 1890 | 345 | 31.7% | |
| 1900 | 319 | −7.5% | |
| 1910 | 420 | 31.7% | |
| 1920 | 442 | 5.2% | |
| 1930 | 409 | −7.5% | |
| 1940 | 376 | −8.1% | |
| 1950 | 414 | 10.1% | |
| 1960 | 414 | 0.0% | |
| 1970 | 415 | 0.2% | |
| 1980 | 416 | 0.2% | |
| 1990 | 379 | −8.9% | |
| 2000 | 405 | 6.9% | |
| 2010 | 355 | −12.3% | |
| 2020 | 329 | −7.3% | |
| U.S. Decennial Census | |||
South Solon in 2010
The census is a count of the population. In 2010, there were 355 people living in South Solon. These people lived in 123 households, and 94 of these were families.
The village had about 1420 people per square mile (548 people per square kilometer). There were 145 housing units, like houses or apartments.
Most people in the village were White (96.9%). A small number were African American (0.3%) or Native American (0.3%). About 2.5% of the people were from two or more races. Also, 2.5% of the population identified as Hispanic or Latino.
Households and Families
Out of the 123 households:
- 38.2% had children under 18 living with them.
- 56.9% were married couples living together.
- 11.4% had a female head of the household with no husband present.
- 8.1% had a male head of the household with no wife present.
- 23.6% were not families (for example, people living alone).
The average household had 2.89 people. The average family had 3.18 people.
Age of Residents
The average age of people in the village was 37.5 years old.
- 24.5% of residents were under 18 years old.
- 11.1% were between 18 and 24 years old.
- 27.4% were between 25 and 44 years old.
- 26% were between 45 and 64 years old.
- 11.3% were 65 years of age or older.
The village had slightly more males (50.7%) than females (49.3%).
See also
 In Spanish: South Solon (Ohio) para niños


