Tripoli, Iowa facts for kids
Quick facts for kids
Tripoli, Iowa
|
|
|---|---|

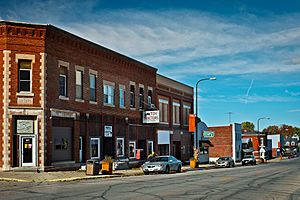
Downtown Tripoli
|
|

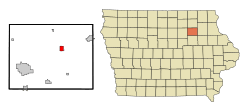
Location of Tripoli, Iowa
|
|
| Country | |
| State | |
| County | Bremer |
| Incorporated | October 16, 1894 |
| Area | |
| • Total | 1.39 sq mi (3.60 km2) |
| • Land | 1.39 sq mi (3.60 km2) |
| • Water | 0.00 sq mi (0.00 km2) |
| Elevation | 1,030 ft (314 m) |
| Population
(2020)
|
|
| • Total | 1,191 |
| • Density | 855.60/sq mi (330.44/km2) |
| Time zone | UTC−6 (Central (CST)) |
| • Summer (DST) | UTC−5 (CDT) |
| ZIP Code |
50676
|
| Area code(s) | 319 |
| FIPS code | 19-78915 |
| GNIS feature ID | 0462329 |
Tripoli (pronounced tri-POH-lə) is a city located in Bremer County, Iowa, in the United States. In 2020, about 1,191 people lived there. Tripoli is part of a larger area called the Waterloo–Cedar Falls Metropolitan Statistical Area. The city's post office first opened way back in 1860.
Contents
Where is Tripoli Located?
Tripoli is found at specific geographic coordinates: 42.805736 degrees North and -92.257580 degrees West.
The United States Census Bureau says that the city covers a total area of about 1.41 square miles (3.60 square kilometers). All of this area is land, meaning there are no large lakes or rivers within the city limits.
What is Tripoli's Climate Like?
Tripoli has a type of weather called a hot-summer humid continental climate. This means it has warm, often humid summers and cold winters. On climate maps, this is shown as "Dfa."
| Climate data for Tripoli, Iowa, 1991–2020 normals, extremes 1946–present | |||||||||||||
|---|---|---|---|---|---|---|---|---|---|---|---|---|---|
| Month | Jan | Feb | Mar | Apr | May | Jun | Jul | Aug | Sep | Oct | Nov | Dec | Year |
| Record high °F (°C) | 62 (17) |
68 (20) |
84 (29) |
96 (36) |
96 (36) |
102 (39) |
101 (38) |
104 (40) |
98 (37) |
93 (34) |
79 (26) |
65 (18) |
104 (40) |
| Mean maximum °F (°C) | 44.7 (7.1) |
49.7 (9.8) |
68.1 (20.1) |
79.7 (26.5) |
87.0 (30.6) |
92.3 (33.5) |
92.8 (33.8) |
90.7 (32.6) |
89.1 (31.7) |
82.5 (28.1) |
65.9 (18.8) |
49.6 (9.8) |
94.5 (34.7) |
| Mean daily maximum °F (°C) | 24.8 (−4.0) |
29.2 (−1.6) |
42.8 (6.0) |
57.6 (14.2) |
70.0 (21.1) |
79.6 (26.4) |
82.8 (28.2) |
80.9 (27.2) |
74.5 (23.6) |
61.0 (16.1) |
44.3 (6.8) |
30.9 (−0.6) |
56.5 (13.6) |
| Daily mean °F (°C) | 16.1 (−8.8) |
20.3 (−6.5) |
33.4 (0.8) |
46.6 (8.1) |
58.9 (14.9) |
69.1 (20.6) |
72.2 (22.3) |
69.9 (21.1) |
62.4 (16.9) |
49.6 (9.8) |
35.0 (1.7) |
22.7 (−5.2) |
46.4 (8.0) |
| Mean daily minimum °F (°C) | 7.3 (−13.7) |
11.5 (−11.4) |
24.0 (−4.4) |
35.6 (2.0) |
47.9 (8.8) |
58.6 (14.8) |
61.6 (16.4) |
59.0 (15.0) |
50.3 (10.2) |
38.2 (3.4) |
25.6 (−3.6) |
14.6 (−9.7) |
36.2 (2.3) |
| Mean minimum °F (°C) | −15.6 (−26.4) |
−10.1 (−23.4) |
0.9 (−17.3) |
21.3 (−5.9) |
33.7 (0.9) |
46.1 (7.8) |
50.9 (10.5) |
48.7 (9.3) |
35.5 (1.9) |
23.0 (−5.0) |
8.3 (−13.2) |
−7.6 (−22.0) |
−19.2 (−28.4) |
| Record low °F (°C) | −32 (−36) |
−32 (−36) |
−27 (−33) |
0 (−18) |
24 (−4) |
36 (2) |
43 (6) |
38 (3) |
25 (−4) |
10 (−12) |
−15 (−26) |
−28 (−33) |
−32 (−36) |
| Average precipitation inches (mm) | 1.23 (31) |
1.09 (28) |
2.00 (51) |
3.93 (100) |
5.11 (130) |
6.03 (153) |
4.80 (122) |
4.29 (109) |
3.75 (95) |
2.96 (75) |
1.98 (50) |
1.47 (37) |
38.64 (981) |
| Average snowfall inches (cm) | 6.5 (17) |
6.3 (16) |
4.3 (11) |
1.5 (3.8) |
0.0 (0.0) |
0.0 (0.0) |
0.0 (0.0) |
0.0 (0.0) |
0.0 (0.0) |
02 (5.1) |
3.1 (7.9) |
11.1 (28) |
33.0 (84) |
| Average precipitation days (≥ 0.01 in) | 7.4 | 6.7 | 8.4 | 10.5 | 12.2 | 11.6 | 8.8 | 9.0 | 8.7 | 8.5 | 6.8 | 7.4 | 106 |
| Average snowy days (≥ 0.1 in) | 4.6 | 3.9 | 2.0 | 0.9 | 0.0 | 0.0 | 0.0 | 0.0 | 0.0 | 0.1 | 1.7 | 5.7 | 18.9 |
| Source 1: NOAA (average snowfall/snow days 1981–2010) | |||||||||||||
| Source 2: National Weather Service | |||||||||||||
How Has Tripoli's Population Changed?
| Historical Populations | ||
|---|---|---|
| Year | Pop. | ±% |
| 1880 | 65 | — |
| 1900 | 655 | +907.7% |
| 1910 | 755 | +15.3% |
| 1920 | 914 | +21.1% |
| 1930 | 891 | −2.5% |
| 1940 | 1,001 | +12.3% |
| 1950 | 1,124 | +12.3% |
| 1960 | 1,179 | +4.9% |
| 1970 | 1,345 | +14.1% |
| 1980 | 1,280 | −4.8% |
| 1990 | 1,188 | −7.2% |
| 2000 | 1,310 | +10.3% |
| 2010 | 1,313 | +0.2% |
| 2020 | 1,191 | −9.3% |
| Sources: Source: |
||
This table shows how the number of people living in Tripoli has changed over many years. You can see the population grew quite a bit from 1880 to 1970, then it has gone up and down a bit since then.
Tripoli's Population in 2020
According to the census taken in 2020, there were 1,191 people living in Tripoli. These people lived in 508 different homes, and 323 of these were families. The city had about 855 people per square mile. There were 554 housing units in total.
Most people in Tripoli (about 95.4%) were White. A small number of people were from other racial backgrounds or from two or more races. About 1.3% of the population identified as Hispanic or Latino.
- About 26.8% of homes had children under 18 living there.
- Half of the homes (50.6%) were married couples living together.
- The average age of people in Tripoli was 41.2 years old.
- About 24.5% of residents were under 20 years old.
- The number of males and females in the city was almost equal, with 50.0% male and 50.0% female.
Tripoli's Population in 2010
In the 2010 census, Tripoli had 1,313 people. There were 540 homes, and 356 of them were families. The city had about 931 people per square mile. There were 568 housing units.
Most people (98.2%) were White. About 1.1% of the population was Hispanic or Latino.
- About 33.3% of homes had children under 18.
- About 51.1% of homes were married couples.
- The average age in the city was 40.5 years.
- About 26% of residents were under 18 years old.
- The city had slightly more females (53.0%) than males (47.0%).
Education in Tripoli
The Tripoli Community School District is in charge of the public schools in the area. They make sure students in Tripoli get their education.
See also
 In Spanish: Tripoli (Iowa) para niños
 | Janet Taylor Pickett |
 | Synthia Saint James |
 | Howardena Pindell |
 | Faith Ringgold |


