
Usage share of web browsers facts for kids
The usage share of web browsers tells us how many people use a certain web browser out of all the people visiting a group of websites. For example, if Internet Explorer has 7% usage share, it means that about 7 out of every 100 visitors to those websites use some version of Internet Explorer.
Contents
Why Browser Usage Numbers Can Be Tricky
It's not always easy to get exact numbers for how many people use each browser. Counting every time a browser asks for a page (called a "page hit") can sometimes be misleading.
When Numbers Might Be Too High
Sometimes, a browser's usage might seem higher than it really is. Here's why:
- Some browsers automatically refresh a webpage often, even if you're not doing anything. This makes it look like more activity.
- Apps that read news feeds, like RSS or Atom feeds, might ask for updates regularly without you clicking.
- Older browsers, like Internet Explorer, sometimes need extra files (like CSS or JavaScript tricks) to display pages correctly. These extra requests add to their count.
- Browsers like Firefox can sometimes secretly load pages you might click next, which also adds to their "hits."
- If you switch browsers and then visit the same site, you might be counted twice.
- Some anti-virus programs pretend to be popular browsers to trick bad websites. For example, AVG Linkscanner once made it look like IE6 was used much more than it was.
- Other software, like tools that check websites or crawlers (which scan the internet), can also pretend to be normal browsers.
- Browsers like Safari update pictures of your favorite sites in the background, creating more "hits."
When Numbers Might Be Too Low
On the other hand, a browser's usage might be underestimated:
- A browser that shows pictures and fancy designs usually makes more "hits" than a simple text-only browser because it downloads more files (like images, CSS, and JavaScript).
- Many browsers and download managers can hide what they really are (their "user agent string"). They do this to avoid problems with websites that might not work well with their browser. For example, older versions of Opera used to pretend to be Internet Explorer.
- Text-only browsers don't download tiny tracking images (called "web bugs"), so they might not be counted.
- Some browsers, like Firefox and Opera, save web pages very well. If you go back to a page you just visited, they might show it from memory instead of asking the server again. This means fewer "hits" are counted.
- Some browser add-ons or security programs, like NoScript, can block parts of web pages (like JavaScript or Adobe Flash). This can also affect how browser usage is tracked.
- If many people use the internet through one proxy (like on some mobile phones), they might all be counted as just one user.
- Browsers that save web pages well, following internet rules, might be counted less than those that don't.
- Extra programs (plug-ins) can change how a browser identifies itself, leading to wrong counts.
- Browser identification strings aren't always the same. For example, many browsers pretend to be "Mozilla 5.0."
- Some internet providers, especially for mobile phones, might remove the browser's identification string completely.
Current Browser Usage Summary
Here's a quick look at how different browsers were used recently across all devices:
| Browser | StatCounter June 2018 |
NetMarketShare May 2018 |
Wikimedia May 2018 |
|---|---|---|---|
| Chrome | 58.94% | 60.60% | 47.77% |
| Safari | 13.70% | 17.27% | 22.16% |
| UC | 7.46% | 1.69% | 0.32% |
| Firefox | 5.17% | 5.89% | 6.21% |
| Opera | 3.50% | 2.07% | 1.16% |
| IE | 3.12% | 5.85% | 7.30% |
| Samsung Internet | 2.67% | N/A | 0.74% |
| Edge | 1.89% | 2.06% | 1.93% |
| AOSP | 1.56% | 1.10% | 1.02% |
| Others | 2.01% | 3.47% | 11.39% |
How Browser Usage Has Changed Over Time
Let's look at how browser usage has changed over the years, based on data from Net Applications.
Net Applications (2004 to 2010)
.svg)
Net Applications gathers its usage data from about 40,000 websites, which get around 160 million unique visitors.
Starting in August 2009, Net Applications began adjusting its data based on the number of internet users in different countries. This change was also applied to older data. The table below shows this adjusted data from late 2007 onwards.
| Period |
Internet Explorer |
Firefox |
Chrome |
Safari |
Opera |
Netscape |
Mozilla |
|---|---|---|---|---|---|---|---|
| 2010 Q2 | 60.01% | 24.24% | 7.00% | 4.78% | 2.33% | 0.49% | 0.12% |
| 2010 Q1 | 61.43% | 24.40% | 5.67% | 4.55% | 2.37% | 0.52% | 0.15% |
| 2009 Q4 | 63.67% | 24.46% | 4.04% | 4.41% | 2.29% | 0.32% | 0.11% |
| 2009 Q3 | 66.80% | 23.06% | 2.86% | 4.13% | 2.07% | 0.50% | 0.09% |
| 2009 Q2 | 68.06% | 23.00% | 2.13% | 3.67% | 2.05% | 0.68% | 0.06% |
| 2009 Q1 | 69.13% | 22.67% | 1.56% | 3.58% | 2.18% | 0.51% | 0.06% |
| 2008 Q4 | 71.99% | 20.78% | 1.16% | 3.11% | 2.15% | 0.41% | 0.07% |
| 2008 Q3 | 74.93% | 19.07% | 0.37% | 2.73% | 2.06% | 0.43% | 0.07% |
| 2008 Q2 | 76.24% | 18.16% | 2.73% | 1.97% | 0.48% | 0.08% | |
| 2008 Q1 | 77.83% | 16.86% | 2.65% | 1.84% | 0.41% | 0.13% | |
| 2007 Q4 | 79.16% | 15.84% | 2.39% | 1.78% | 0.50% | 0.09% | |
| 2007 Q3 | 78.85% | 14.69% | 4.80% | 0.51% | 0.76% | 0.11% | |
| 2007 Q2 | 78.76% | 14.92% | 4.66% | 0.46% | 0.83% | 0.15% | |
| 2007 Q1 | 79.38% | 14.35% | 4.70% | 0.50% | 0.77% | 0.19% | |
| 2006 Q4 | 80.69% | 13.50% | 4.06% | 0.56% | 0.86% | 0.23% | |
| 2006 Q3 | 82.88% | 11.89% | 3.30% | 0.62% | 0.88% | 0.26% | |
| 2006 Q2 | 84.03% | 10.67% | 3.25% | 0.57% | 0.98% | 0.32% | |
| 2006 Q1 | 85.01% | 9.77% | 3.10% | 0.53% | 1.09% | 0.36% | |
| 2005 Q4 | 85.88% | 9.00% | 2.80% | 0.54% | 1.25% | 0.43% | |
| 2005 Q3 | 86.74% | 7.97% | 2.24% | 0.55% | 1.92% | 0.48% | |
| 2005 Q2 | 87.24% | 8.08% | 1.89% | 0.52% | 1.62% | 0.59% | |
| 2005 Q1 | 89.02% | 6.17% | 1.70% | 0.49% | 1.89% | 0.67% | |
| 2004 Q4 | 91.35% | 3.66% | 1.50% | 0.51% | 2.09% | 0.80% | |
| Period |
Internet Explorer |
Firefox |
Chrome |
Safari |
Opera |
Netscape |
Mozilla |
Related Pages
- List of web browsers
- Usage share, Market share
Images for kids
-
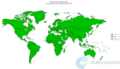
The most used web browser per country in November 2020.
-
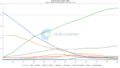
Usage share of web browsers according to StatCounter.
-
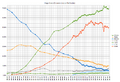
Usage share of web browsers according to StatCounter till 2019-05. See HTML5 beginnings, Presto rendering engine deprecation and Chrome's dominance.

.png)

