
Valchava facts for kids
Quick facts for kids
Valchava
|
||
|---|---|---|
|
||

Valchava
Location in Switzerland

Valchava
Location in Canton of Graubünden
|
||
| Country | Switzerland | |
| Canton | Graubünden | |
| District | Inn | |
| Area | ||
| • Total | 16.71 km2 (6.45 sq mi) | |
| Elevation | 1,440 m (4,720 ft) | |
| Population | ||
| • Total | 203 | |
| • Density | 12.15/km2 (31.46/sq mi) | |
| Postal code |
7535
|
|


Valchava is a lovely village located in the Val Müstair (also known as the Müstair valley) in the canton of Graubünden, Switzerland. It used to be an independent municipality (like a small town with its own government). However, on January 1, 2009, Valchava joined with five other nearby villages: Fuldera, Lü, Müstair, Santa Maria Val Müstair, and Tschierv. Together, they formed a new, larger municipality called Val Müstair.
Contents
History of Valchava
Valchava was first mentioned in old documents in the year 1331. This shows that the village has a long history! For a while, until 1943, it was known by a slightly different name, Valcava.
Geography and Nature


Valchava covers an area of about 16.7 square kilometers (about 6.4 square miles). A large part of this land, almost half (46%), is used for farming. About a third (33.9%) is covered by forests, which are great for exploring!
A small part of the land (1.4%) has buildings and roads. The rest (18.7%) is made up of natural features like rivers, glaciers, or mountains. These areas are not used for farming or building.
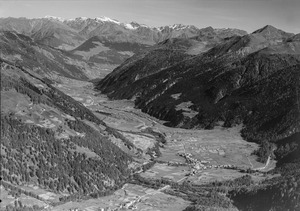
The village itself is a "linear village," meaning it stretches out along a road. It is located above another village called Santa Maria Val Müstair. Valchava also includes two alpine settlements, which are small groups of buildings high up in the mountains, named Chaunt and Valpaschun.
Population and Community
Valchava had a population of 203 people in 2008. A small percentage of these residents (3.4%) were from other countries. Over the ten years before 2008, the population became a little smaller.
In the year 2000, the population was almost evenly split between males (51%) and females (49%). There were many young people, with about 9.4% of the population being children aged 0 to 9, and another 9.4% being teenagers aged 10 to 14. About 5.9% were teenagers aged 15 to 19.
Most adults were between 20 and 59 years old. There were also many older people, with about 11.9% of the population being between 60 and 69 years old, and 7.9% being between 70 and 79. A few people were even older, between 80 and 99 years old.
When it comes to education, about 45.6% of adults in Valchava (aged 25-64) have completed higher education. This means they went to a university or a special college for applied sciences.
The village has a very low unemployment rate, which means almost everyone who wants to work has a job. In 2005, there were 15 people working in farming and related businesses. Another 14 people worked in manufacturing or construction. The largest group, 24 people, worked in the service sector, which includes jobs like tourism, shops, and healthcare.
Here's a quick look at how the population has changed over the years:
| Year | Population |
|---|---|
| 1850 | 208 |
| 1900 | 218 |
| 1950 | 252 |
| 2000 | 202 |
Languages Spoken
The main language spoken in Valchava is Rhaeto-Romance, often just called Romansh. In 2000, about 80.7% of the people spoke Romansh. The second most common language was German (18.3%), and a small number of people spoke Italian (1.0%).
The Romansh speakers in Valchava use a special local version of the language called the Jauer dialect. Over the years, the number of people speaking Romansh as their first language has changed:
- In 1880, about 69% spoke Romansh.
- In 1910, it was 72%.
- In 1941, it was 75%.
- In 1970, it reached 90%.
Even if Romansh wasn't their first language, many people understood it. In both 1990 and 2000, about 92% of the population understood Romansh.
Here's a table showing the language breakdown from different years:
| Languages | Census 1980 | Census 1990 | Census 2000 | |||
|---|---|---|---|---|---|---|
| Number | Percent | Number | Percent | Number | Percent | |
| German | 44 | 20.18% | 31 | 15.20% | 37 | 18.32% |
| Romansh | 168 | 77.06% | 167 | 81.86% | 163 | 80.69% |
| Italian | 5 | 2.29% | 6 | 2.94% | 2 | 0.99% |
| Total Population | 218 | 100% | 204 | 100% | 202 | 100% |
See also
 In Spanish: Valchava para niños
