
Virieu-le-Petit facts for kids
Quick facts for kids
Virieu-le-Petit
|
|
|---|---|
|
Part of Arvière-en-Valromey
|
|

Église St Pierre
|
|

Virieu-le-Petit
Location in France

Virieu-le-Petit
Location in Auvergne-Rhône-Alpes
|
|
| Country | France |
| Region | Auvergne-Rhône-Alpes |
| Department | Ain |
| Arrondissement | Belley |
| Canton | Plateau d'Hauteville |
| Commune | Arvière-en-Valromey |
| Area
1
|
16.4 km2 (6.3 sq mi) |
| Population
(2021)
|
330 |
| • Density | 20.1/km2 (52.1/sq mi) |
| Time zone | UTC+01:00 (CET) |
| • Summer (DST) | UTC+02:00 (CEST) |
| Postal code |
01260
|
| Elevation | 419–1,524 m (1,375–5,000 ft) (avg. 635 m or 2,083 ft) |
| 1 French Land Register data, which excludes lakes, ponds, glaciers > 1 km2 (0.386 sq mi or 247 acres) and river estuaries. | |
Virieu-le-Petit was once a small town, or commune, located in eastern France. It was part of the Ain area, which is like a county or department.
On January 1, 2019, Virieu-le-Petit joined with other nearby towns. They all became part of a new, larger commune called Arvière-en-Valromey.
Contents
Understanding Virieu-le-Petit's Location
Virieu-le-Petit is found in the eastern part of France. It is nestled in the Ain department, which is known for its beautiful landscapes.
What is a Commune?
In France, a commune is the smallest unit of local government. Think of it like a town or a village with its own local council. It's how France organizes its many communities.
What is a Department?
A department in France is a larger area, similar to a county or a state. It groups many communes together. The Ain department is one of many such areas in France.
Weather and Climate in Virieu-le-Petit
Virieu-le-Petit has an oceanic climate. This means it has mild temperatures and rain throughout the year. It doesn't get too hot or too cold.
Average Temperatures and Rainfall
The average yearly temperature in Virieu-le-Petit is about 11 degrees Celsius (51.8°F). The area receives a lot of rain, with about 1364 millimeters (53.7 inches) each year. November is usually the wettest month.
The warmest month is July, with average temperatures around 20.2 degrees Celsius (68.4°F). January is the coldest, averaging about 1.7 degrees Celsius (35.1°F).
Temperature Records
The hottest temperature ever recorded in Virieu-le-Petit was 37.6 degrees Celsius (99.7°F). This happened on August 13, 2003. The coldest temperature recorded was -14.2 degrees Celsius (6.4°F) on February 5, 2012.
| Climate data for Virieu-le-Petit (1981–2010 averages, extremes 1999−2018) | |||||||||||||
|---|---|---|---|---|---|---|---|---|---|---|---|---|---|
| Month | Jan | Feb | Mar | Apr | May | Jun | Jul | Aug | Sep | Oct | Nov | Dec | Year |
| Record high °C (°F) | 15.4 (59.7) |
17.7 (63.9) |
23.0 (73.4) |
28.0 (82.4) |
31.3 (88.3) |
35.2 (95.4) |
35.6 (96.1) |
37.6 (99.7) |
29.4 (84.9) |
24.6 (76.3) |
20.1 (68.2) |
17.5 (63.5) |
37.6 (99.7) |
| Mean daily maximum °C (°F) | 4.9 (40.8) |
6.9 (44.4) |
11.4 (52.5) |
15.8 (60.4) |
20.0 (68.0) |
24.2 (75.6) |
25.8 (78.4) |
24.8 (76.6) |
20.7 (69.3) |
15.9 (60.6) |
9.1 (48.4) |
5.2 (41.4) |
15.4 (59.7) |
| Daily mean °C (°F) | 1.7 (35.1) |
3.0 (37.4) |
6.8 (44.2) |
10.6 (51.1) |
14.9 (58.8) |
18.6 (65.5) |
20.2 (68.4) |
19.5 (67.1) |
15.8 (60.4) |
11.8 (53.2) |
5.9 (42.6) |
2.2 (36.0) |
11.0 (51.8) |
| Mean daily minimum °C (°F) | −1.4 (29.5) |
−0.8 (30.6) |
2.3 (36.1) |
5.4 (41.7) |
9.7 (49.5) |
13.0 (55.4) |
14.5 (58.1) |
14.2 (57.6) |
10.9 (51.6) |
7.6 (45.7) |
2.8 (37.0) |
−0.8 (30.6) |
6.5 (43.7) |
| Record low °C (°F) | −11.9 (10.6) |
−14.2 (6.4) |
−10.9 (12.4) |
−4.5 (23.9) |
1.4 (34.5) |
3.2 (37.8) |
7.2 (45.0) |
7.7 (45.9) |
2.2 (36.0) |
−3.1 (26.4) |
−7.2 (19.0) |
−13.1 (8.4) |
−14.2 (6.4) |
| Average precipitation mm (inches) | 117.0 (4.61) |
109.4 (4.31) |
122.1 (4.81) |
104.7 (4.12) |
112.6 (4.43) |
77.4 (3.05) |
97.6 (3.84) |
126.7 (4.99) |
97.1 (3.82) |
134.4 (5.29) |
136.6 (5.38) |
128.3 (5.05) |
1,363.9 (53.70) |
| Average precipitation days (≥ 1.0 mm) | 10.8 | 10.3 | 11.5 | 10.3 | 11.3 | 9.0 | 9.5 | 11.4 | 8.3 | 11.4 | 11.8 | 11.7 | 127.3 |
| Source: Meteociel | |||||||||||||
Population Changes in Virieu-le-Petit
The number of people living in Virieu-le-Petit has changed over the years. Here's a look at its population history:
| Historical population | ||
|---|---|---|
| Year | Pop. | ±% p.a. |
| 2006 | 310 | — |
| 2011 | 307 | −0.19% |
| 2015 | 302 | −0.41% |
| 2021 | 330 | +1.49% |
| Source: INSEE | ||
Images for kids
-
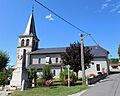
Église St Pierre
See also

- In Spanish: Virieu-le-Petit para niños
