Wasta, South Dakota facts for kids
Quick facts for kids
Wasta, South Dakota
wašté
|
|
|---|---|

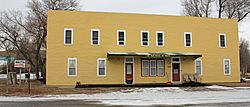
The Wasta Hotel, located at Ash and B streets in Wasta. It is listed on the National Register of Historic Places
|
|

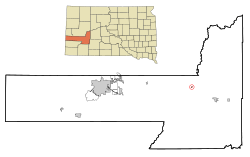
Location in Pennington County and the state of South Dakota
|
|
| Country | United States |
| State | South Dakota |
| County | Pennington |
| Incorporated | 1930 |
| Area | |
| • Total | 0.19 sq mi (0.50 km2) |
| • Land | 0.19 sq mi (0.50 km2) |
| • Water | 0.00 sq mi (0.00 km2) |
| Elevation | 2,323 ft (708 m) |
| Population
(2020)
|
|
| • Total | 65 |
| • Density | 338.54/sq mi (130.83/km2) |
| Time zone | UTC-7 (Mountain (MST)) |
| • Summer (DST) | UTC-6 (MDT) |
| ZIP codes |
57767, 57791
|
| Area code(s) | 605 |
| FIPS code | 46-69140 |
| GNIS feature ID | 1267626 |
Wasta is a small town in Pennington County, South Dakota, United States. It is located right next to the Cheyenne River. In 2020, only 65 people lived there. The name Wasta comes from the Dakota word "wašté," which means "good."
Contents
History of Wasta
The town of Wasta has had a post office since 1907. This means people could send and receive mail there. The name "Wasta" was chosen because it means "good" in the Dakota language.
Geography and Location
Wasta is located in the western part of South Dakota. It sits right along Interstate 90, a major highway. This makes it easy to get to and from the town.
The United States Census Bureau says that Wasta covers a total area of about 0.19 square miles (0.50 square kilometers). All of this area is land, with no water.
Wasta's Climate and Weather
Wasta experiences different weather throughout the year. Here's a look at the typical conditions:
| Climate data for Wasta, South Dakota (1991–2020 normals, extremes 1949–present) | |||||||||||||
|---|---|---|---|---|---|---|---|---|---|---|---|---|---|
| Month | Jan | Feb | Mar | Apr | May | Jun | Jul | Aug | Sep | Oct | Nov | Dec | Year |
| Record high °F (°C) | 78 (26) |
77 (25) |
86 (30) |
97 (36) |
102 (39) |
111 (44) |
111 (44) |
109 (43) |
107 (42) |
98 (37) |
86 (30) |
72 (22) |
111 (44) |
| Mean maximum °F (°C) | 59.3 (15.2) |
63.3 (17.4) |
76.7 (24.8) |
84.6 (29.2) |
90.2 (32.3) |
97.9 (36.6) |
101.6 (38.7) |
101.9 (38.8) |
99.4 (37.4) |
87.2 (30.7) |
73.1 (22.8) |
60.3 (15.7) |
104.0 (40.0) |
| Mean daily maximum °F (°C) | 35.1 (1.7) |
39.0 (3.9) |
50.2 (10.1) |
60.1 (15.6) |
69.7 (20.9) |
80.4 (26.9) |
89.0 (31.7) |
88.3 (31.3) |
79.1 (26.2) |
63.1 (17.3) |
49.0 (9.4) |
37.4 (3.0) |
61.7 (16.5) |
| Daily mean °F (°C) | 22.2 (−5.4) |
25.8 (−3.4) |
36.2 (2.3) |
46.3 (7.9) |
56.6 (13.7) |
67.2 (19.6) |
74.6 (23.7) |
73.2 (22.9) |
63.2 (17.3) |
48.4 (9.1) |
35.0 (1.7) |
24.6 (−4.1) |
47.8 (8.8) |
| Mean daily minimum °F (°C) | 9.4 (−12.6) |
12.6 (−10.8) |
22.2 (−5.4) |
32.6 (0.3) |
43.5 (6.4) |
53.9 (12.2) |
60.1 (15.6) |
58.0 (14.4) |
47.3 (8.5) |
33.6 (0.9) |
21.0 (−6.1) |
11.7 (−11.3) |
33.8 (1.0) |
| Mean minimum °F (°C) | −14.7 (−25.9) |
−11.4 (−24.1) |
0.3 (−17.6) |
15.4 (−9.2) |
28.7 (−1.8) |
40.9 (4.9) |
48.2 (9.0) |
44.8 (7.1) |
31.4 (−0.3) |
14.0 (−10.0) |
0.6 (−17.4) |
−10.6 (−23.7) |
−21.6 (−29.8) |
| Record low °F (°C) | −33 (−36) |
−38 (−39) |
−29 (−34) |
5 (−15) |
15 (−9) |
32 (0) |
38 (3) |
35 (2) |
19 (−7) |
−10 (−23) |
−25 (−32) |
−33 (−36) |
−38 (−39) |
| Average precipitation inches (mm) | 0.28 (7.1) |
0.53 (13) |
0.87 (22) |
1.90 (48) |
3.55 (90) |
2.73 (69) |
2.32 (59) |
1.56 (40) |
1.19 (30) |
1.76 (45) |
0.64 (16) |
0.32 (8.1) |
17.65 (448) |
| Average snowfall inches (cm) | 3.8 (9.7) |
6.4 (16) |
5.5 (14) |
3.7 (9.4) |
0.1 (0.25) |
0.0 (0.0) |
0.0 (0.0) |
0.0 (0.0) |
0.0 (0.0) |
1.1 (2.8) |
4.2 (11) |
5.6 (14) |
30.4 (77) |
| Average precipitation days (≥ 0.01 in) | 2.8 | 3.4 | 3.7 | 6.8 | 8.7 | 9.1 | 6.7 | 5.5 | 4.4 | 5.2 | 2.8 | 2.8 | 61.9 |
| Average snowy days (≥ 0.1 in) | 2.4 | 2.8 | 2.0 | 1.3 | 0.0 | 0.0 | 0.0 | 0.0 | 0.0 | 0.4 | 1.6 | 2.7 | 13.2 |
| Source: NOAA | |||||||||||||
Population Changes in Wasta
The number of people living in Wasta has changed over the years. Here's how the population has looked during different census counts:
| Historical population | |||
|---|---|---|---|
| Census | Pop. | %± | |
| 1940 | 153 | — | |
| 1950 | 144 | −5.9% | |
| 1960 | 196 | 36.1% | |
| 1970 | 127 | −35.2% | |
| 1980 | 99 | −22.0% | |
| 1990 | 82 | −17.2% | |
| 2000 | 75 | −8.5% | |
| 2010 | 80 | 6.7% | |
| 2020 | 65 | −18.7% | |
| U.S. Decennial Census | |||
Wasta's Population in 2010
In 2010, the census showed that 80 people lived in Wasta. These people lived in 36 different homes, and 20 of those were families. The town had about 421 people per square mile.
Most of the people living in Wasta in 2010 were White (100%). A small number (1.3%) were Hispanic or Latino.
- Households: Out of the 36 homes, 25% had children under 18 living there.
- Families: 44.4% of homes were married couples living together.
- Single-person homes: 33.3% of all homes had just one person living in them.
- Age: The average age of people in Wasta was 40.5 years.
- 22.5% of residents were under 18.
- 21.3% were 65 years old or older.
- Gender: The town had slightly more males (52.5%) than females (47.5%).
Education in Wasta
Children in Wasta attend schools that are part of the Wall School District 51-5.
See also
 In Spanish: Wasta (Dakota del Sur) para niños
 | Delilah Pierce |
 | Gordon Parks |
 | Augusta Savage |
 | Charles Ethan Porter |

