Waynesville, Georgia facts for kids
Quick facts for kids
Waynesville
|
|
|---|---|
| Motto(s):
Voted 2022 Best place to live in Georgia Award
|
|
| Country | United States |
| State | Georgia |
| County | Brantley |
| Population
(2020)
|
|
| • Total | 331 |
| Time zone | UTC-5 (Eastern (EST)) |
| • Summer (DST) | UTC-4 (EDT) |
| ZIP codes |
31566
|
Waynesville is a small community in Brantley County, Georgia, United States. It's known as an unincorporated community. This means it doesn't have its own local government like a city does. It's also a census-designated place (CDP). This is a special area the government defines for counting people. Waynesville is part of the larger Brunswick, Georgia metropolitan area. Its ZIP code is 31566. In 2020, the first time it was counted as a CDP, Waynesville had a population of 331 people.
Contents
A Peek into Waynesville's Past
Waynesville got its name from Wayne County. Long ago, Waynesville was part of Wayne County. It's a bit unclear exactly when, but Waynesville might have been the main town, or "county seat," for a while. A county seat is like the capital city for a county. It's where the government offices are located.
Where is Waynesville?
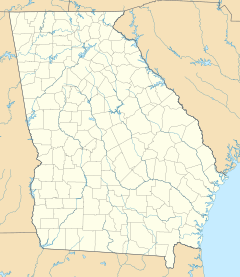
Waynesville is located in the state of Georgia. It sits right near an old road called the Post Road. This road is important because it marks the border. It divides Brantley County from Glynn County.
Who Lives in Waynesville?
Demographics is the study of populations. It helps us understand who lives in a place. According to the 2020 census, Waynesville had a population of 331 people.
Waynesville's Community Mix
The table below shows the different groups of people living in Waynesville in 2020. The census counts people by their race and also by whether they are Hispanic or Latino. People who are Hispanic or Latino can be of any race.
| Race / Ethnicity (NH = Not Hispanic) | Pop 2020 | % 2020 |
|---|---|---|
| White alone (NH) | 288 | 87.01% |
| Black or African American alone (NH) | 11 | 3.32% |
| Native American or Alaska Native alone (NH) | 0 | 0.00% |
| Asian alone (NH) | 3 | 0.91% |
| Pacific Islander alone (NH) | 0 | 0.00% |
| Some Other Race alone (NH) | 4 | 1.21% |
| Mixed Race or Multi-Racial (NH) | 14 | 4.23% |
| Hispanic or Latino (any race) | 11 | 3.32% |
| Total | 331 | 100.00% |
 | William L. Dawson |
 | W. E. B. Du Bois |
 | Harry Belafonte |


