
2016 Australian federal election facts for kids
The 2016 Australian federal election was an important event held on Saturday, 2 July. During this election, Australians voted for all 226 members of their Parliament of Australia. The election campaign lasted for eight weeks.
This election was special because it used a new way of voting for the Senate. This new system, called optional preferential voting, made it easier for voters to choose their preferred candidates. After the votes were counted, Malcolm Turnbull was re-elected. His party formed a government with other smaller parties.
Contents
Who Ran in the Election?
Many people ran to become part of Australia's parliament. Here are some of the main leaders who were hoping to win:
-
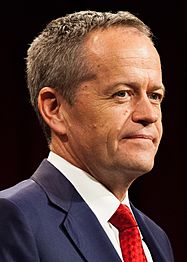
Bill Shorten
(Labor Party)
from Victoria -

Richard Di Natale
(Greens)
from Victoria
.jpg)


How People Voted: The Results
After everyone voted, the counting began. Here's a simple look at how the votes turned out for the two main parts of Parliament:
House of Representatives Votes
The House of Representatives is where laws are first made. Here's how the votes were split among the different parties:
| Popular vote | ||||
|---|---|---|---|---|
| Labor | 34.73% | |||
| Liberal | 28.67% | |||
| Greens | 10.23% | |||
| LNP (QLD) | 8.52% | |||
| National | 4.61% | |||
| NXT | 1.85% | |||
| Katter's | 0.54% | |||
| CLP (NT) | 0.24% | |||
| Independents | 2.81% | |||
| Other | 7.79% | |||
When votes are counted in a special way (called two-party-preferred), it shows how the two main groups would have done against each other:
| Two-party-preferred vote | ||||
|---|---|---|---|---|
| Coalition | 50.36% | |||
| Labor | 49.64% | |||
And here's how many seats each group won in the House of Representatives:
| Seats | ||||
|---|---|---|---|---|
| Coalition | 50.67% | |||
| Labor | 46.00% | |||
| Greens | 0.67% | |||
| NXT | 0.67% | |||
| Katter's | 0.67% | |||
| Independents | 1.33% | |||
Senate Votes
The Senate is the other part of Australia's Parliament. It checks the laws passed by the House of Representatives. Here's how the votes were counted for the Senate:
| Popular vote | ||||
|---|---|---|---|---|
| Labor | 29.79% | |||
| Liberal/National | 20.01% | |||
| Greens | 8.65% | |||
| Liberal | 7.71% | |||
| LNP (QLD) | 6.94% | |||
| NXT | 3.30% | |||
| CLP (NT) | 0.27% | |||
| National | 0.25% | |||
| Other | 23.08% | |||
And here's how many seats each group won in the Senate:
| Seats | ||||
|---|---|---|---|---|
| Coalition | 39.47% | |||
| Labor | 34.21% | |||
| Greens | 11.84% | |||
| NXT | 3.95% | |||
| CLP (NT) | 1.32% | |||
| Other | 10.52% | |||
What Happened After the Election?
After a week of counting votes, no single party had won enough seats to form a government on its own. This meant that neither Malcolm Turnbull's Coalition nor Bill Shorten's Labor Party could easily say they had won.
Malcolm Turnbull then talked with other members of parliament who didn't belong to the main parties. He got their support to form a government. On July 10, Bill Shorten said that his party had lost. Later that day, Malcolm Turnbull announced his victory.
This election was one of the closest federal elections in Australia since 1961. The Coalition was able to form a government with just one more seat than the opposition.
Images for kids
-
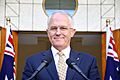
Prime Minister Malcolm Turnbull in March 2016
-
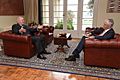
Malcolm Turnbull visits Sir Peter Cosgrove on 8 May 2016 to ask for a new election
-
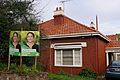
A house in Northcote, Victoria
-
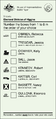
A Senate ballot paper used in Victoria
-
A House of Representatives ballot paper used in the Division of Higgins
.jpg)

_02.jpg)


See also
 In Spanish: Elecciones federales de Australia de 2016 para niños
